
New motor vehicle registrations: Electric vehicles end year with increasing market share
Statistics Canada recently released new motor vehicle registration data for the fourth quarter of 2021 in the Daily.
Statistics Canada recently released new motor vehicle registration data for the fourth quarter of 2021 in the Daily.
The report Transportation in Canada 2021 provides an overview of the Canadian transportation sector and includes information on:
Statistics Canada has launched the Traffic Flow Dashboard as experimental statistical information on the traffic flow on selected road segments in the cities of Calgary and Toronto.
Canada owes the success of its statistical system to a long-standing partnership between Statistics Canada, the citizens of Canada, its businesses, governments and other institutions. Accurate and timely statistical information could not be produced without their continued co-operation and goodwill.
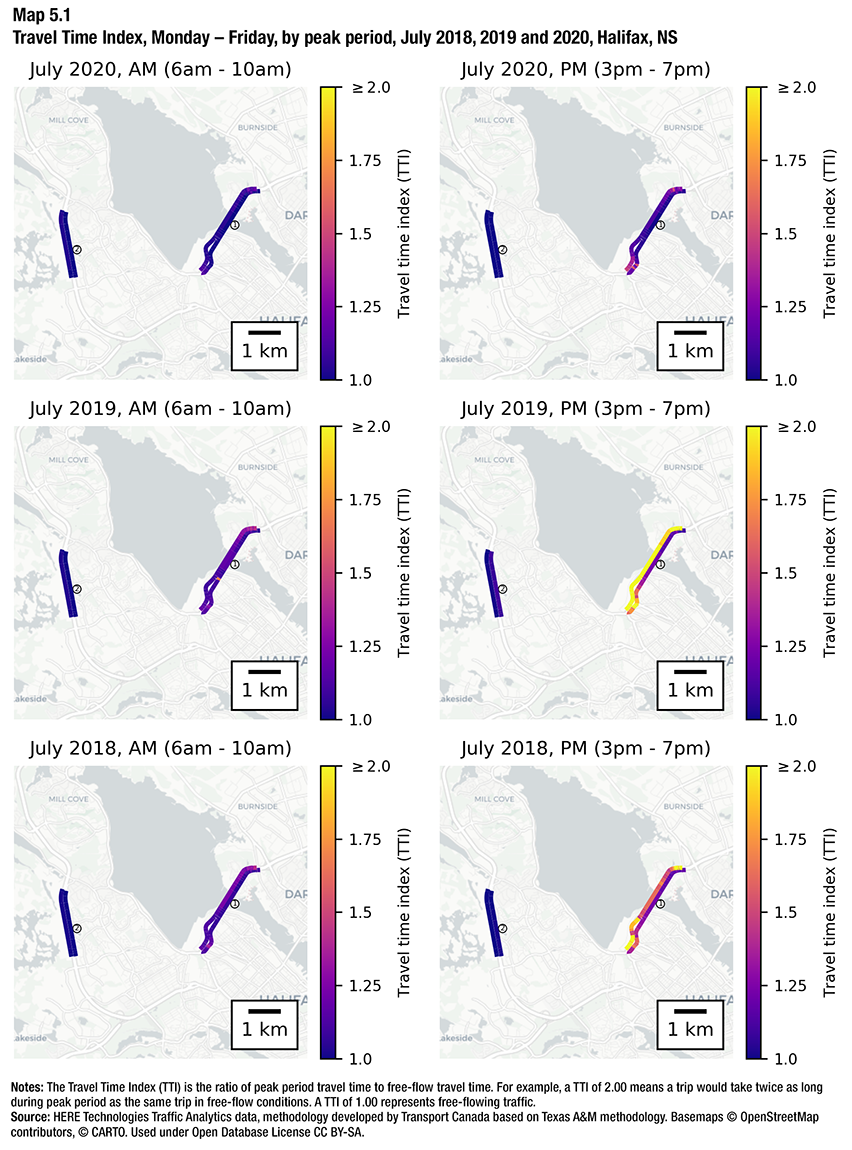
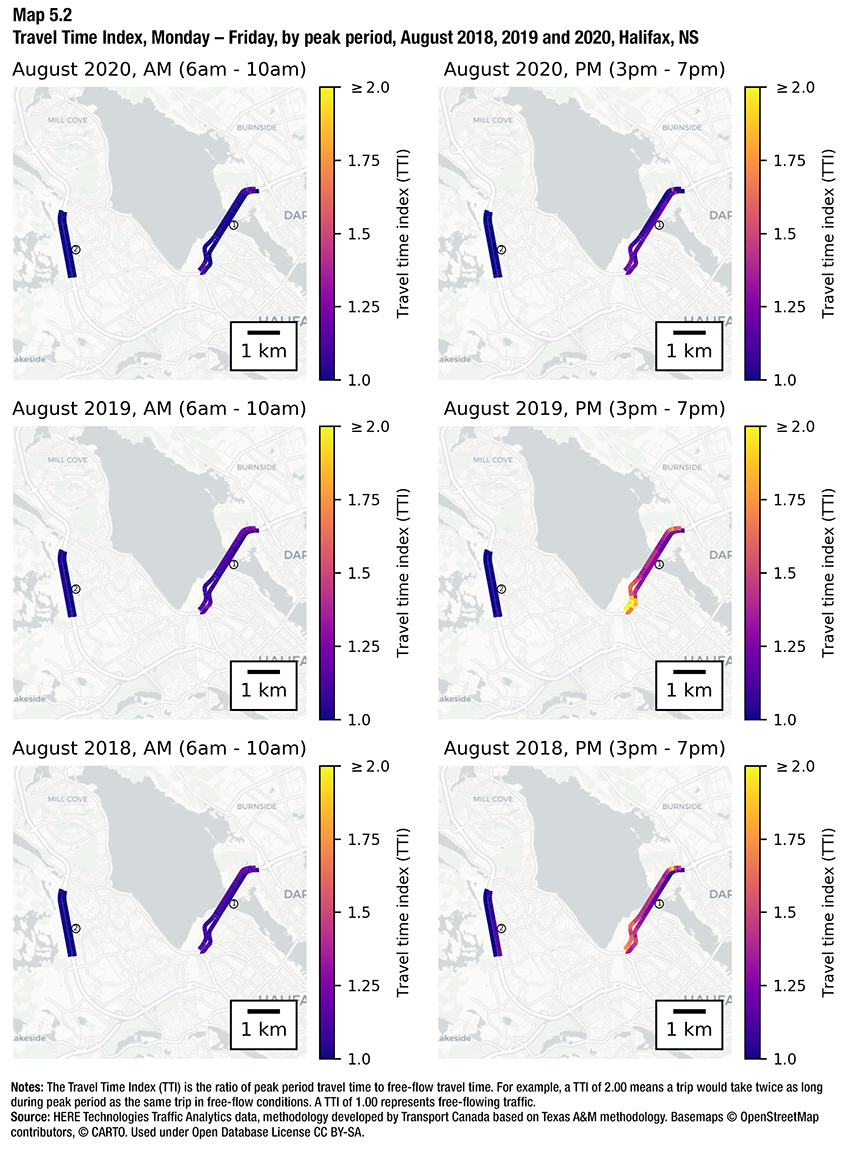
Maps of Halifax show two corridors: Highway 111 and Highway 102, with travel time index (TTI) data color-coded for each corridor.
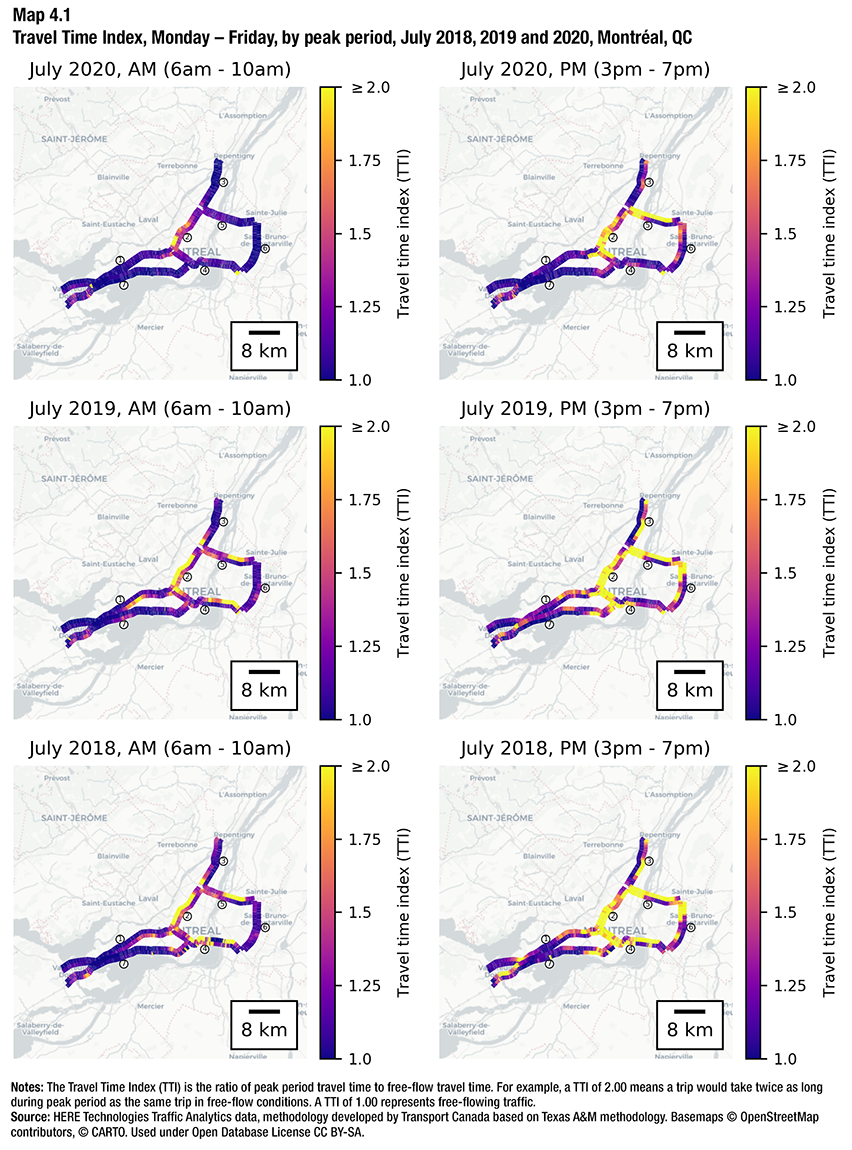
Maps of Montreal show seven corridors: Highway A-40 (three segments), Highway A-10/A-15, Highway A-20/A-25, Highway A-30, and Highway A-20, with travel time index (TTI) data color-coded for each corridor.
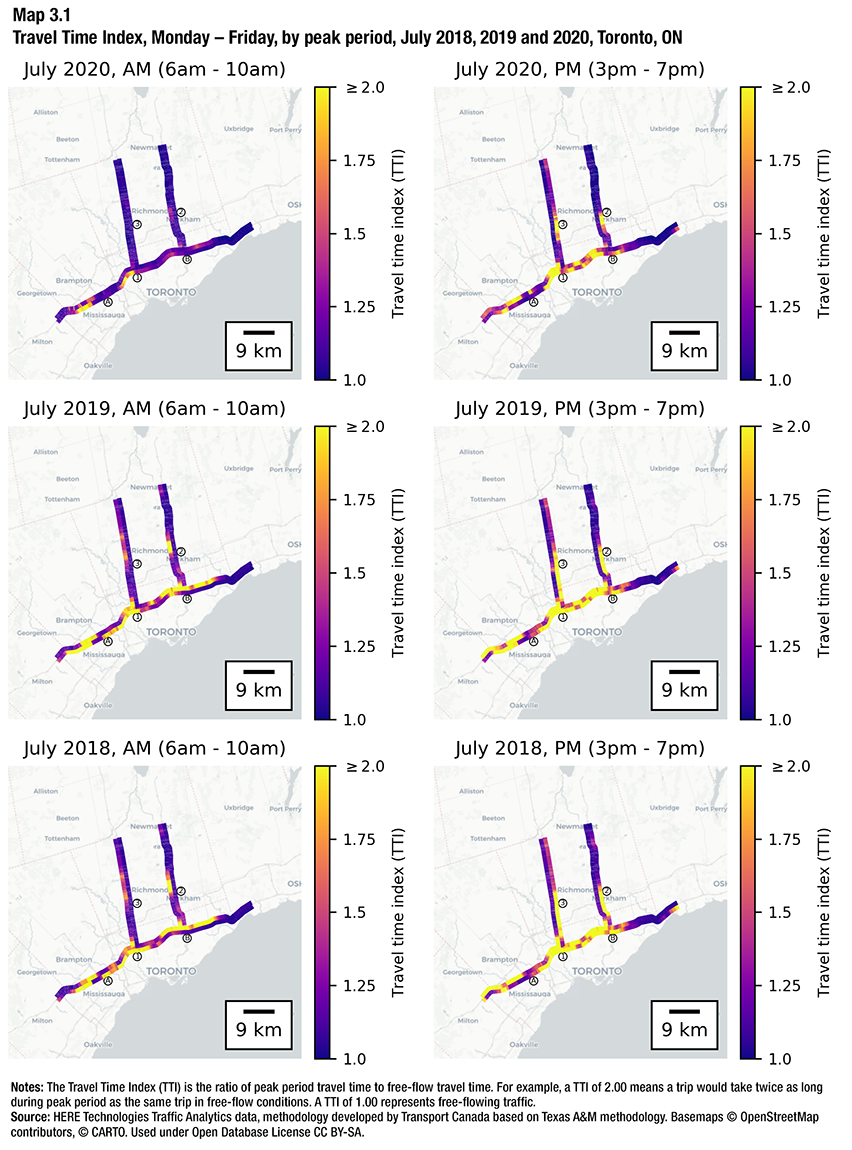
Maps of Toronto show five corridors: Highway 401 collector lanes (two segments), Highway 401 express lanes, Highway 404, and Highway 400, with travel time index (TTI) data color-coded for each corridor.
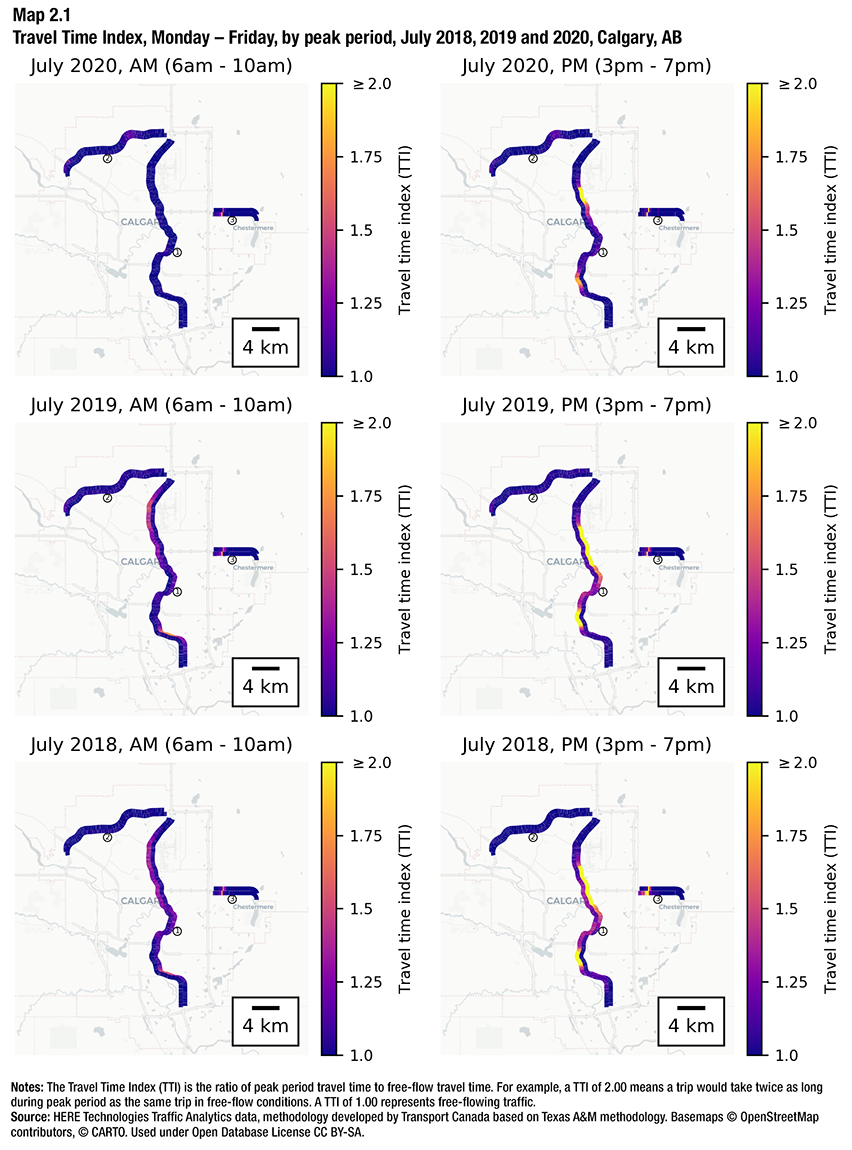
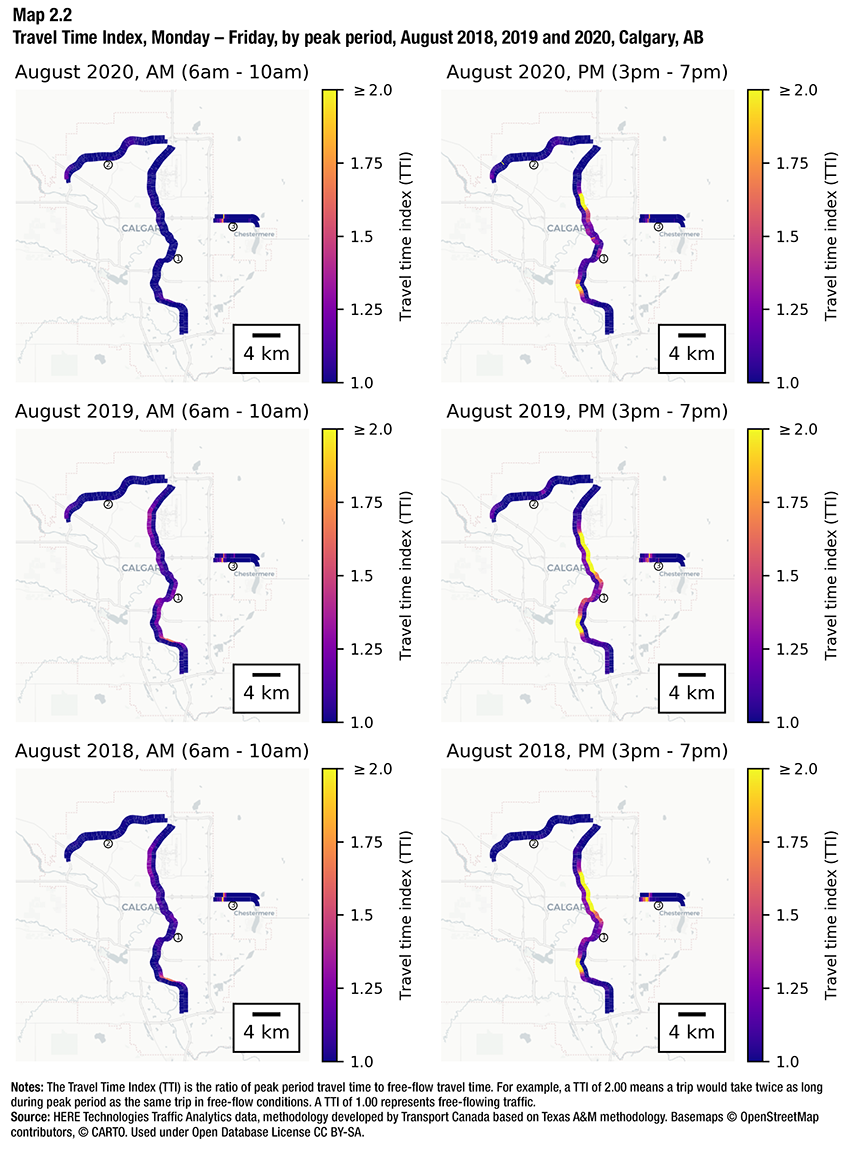
Maps of Calgary show three corridors: Highway 2, Highway 201, and Highway 1, with travel time index (TTI) data color-coded for each corridor.
Maps of Vancouver show four corridors: Highway 99, Highway 91, Highway 17, and Highway 1, with travel time index (TTI) data color-coded for each corridor.
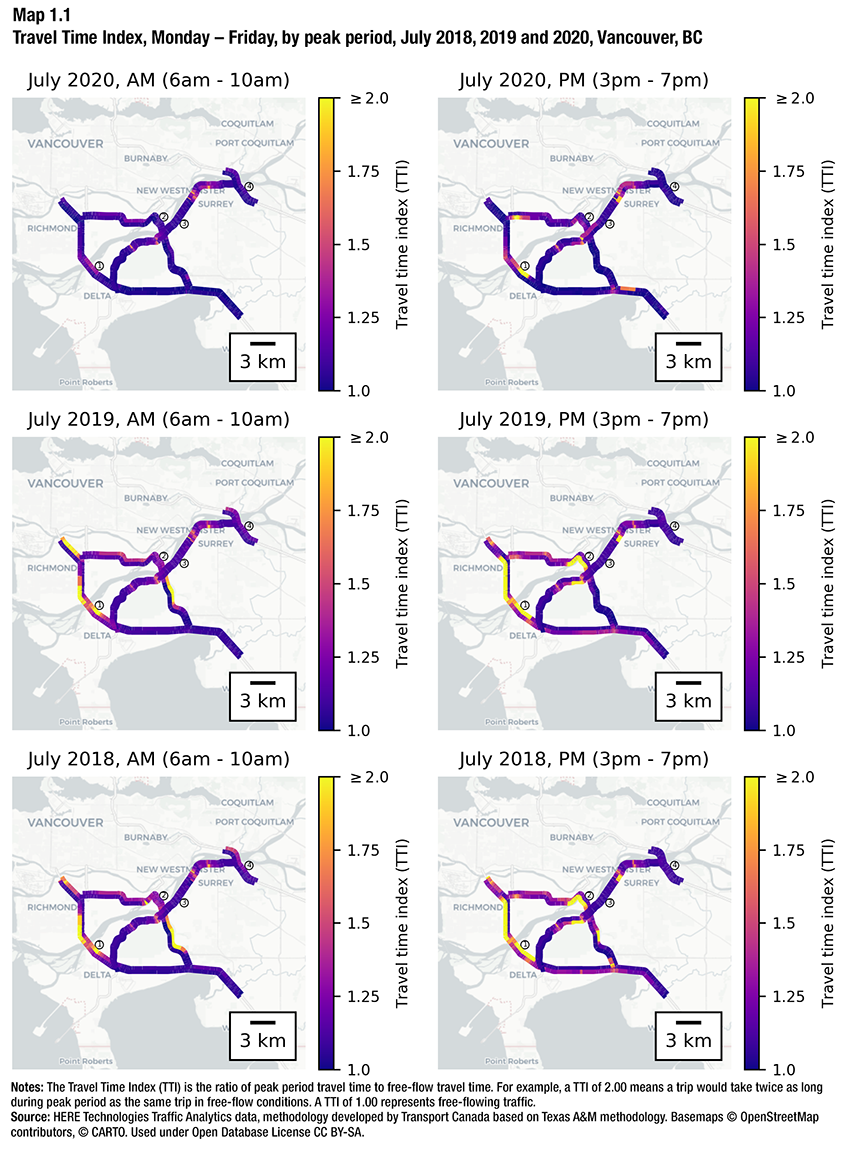
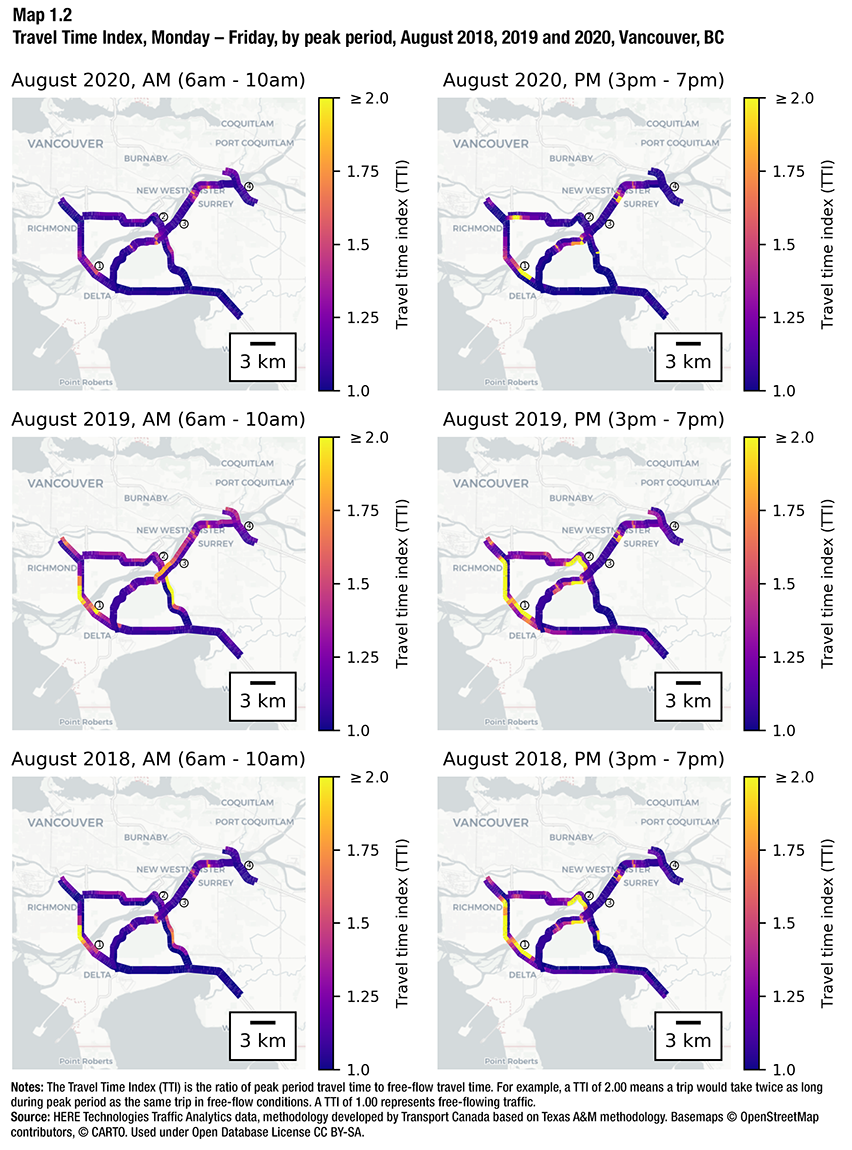
Urban mobility refers to a person’s ability to move around the city where they live and work. Congestion on city roads reduces mobility, which is not only an individual inconvenience but also has an economic impact. While the amount of additional time spent in traffic, excess fuel consumed, and other costs of congestion may be large in Canada, the full impact is not known. Using key indicators to evaluate congestion, its cost, and its impact on the economy is the first step to understanding the magnitude of the problem.