
Maps of Toronto show five corridors: Highway 401 collector lanes (two segments), Highway 401 express lanes, Highway 404, and Highway 400, with travel time index (TTI) data color-coded for each corridor.
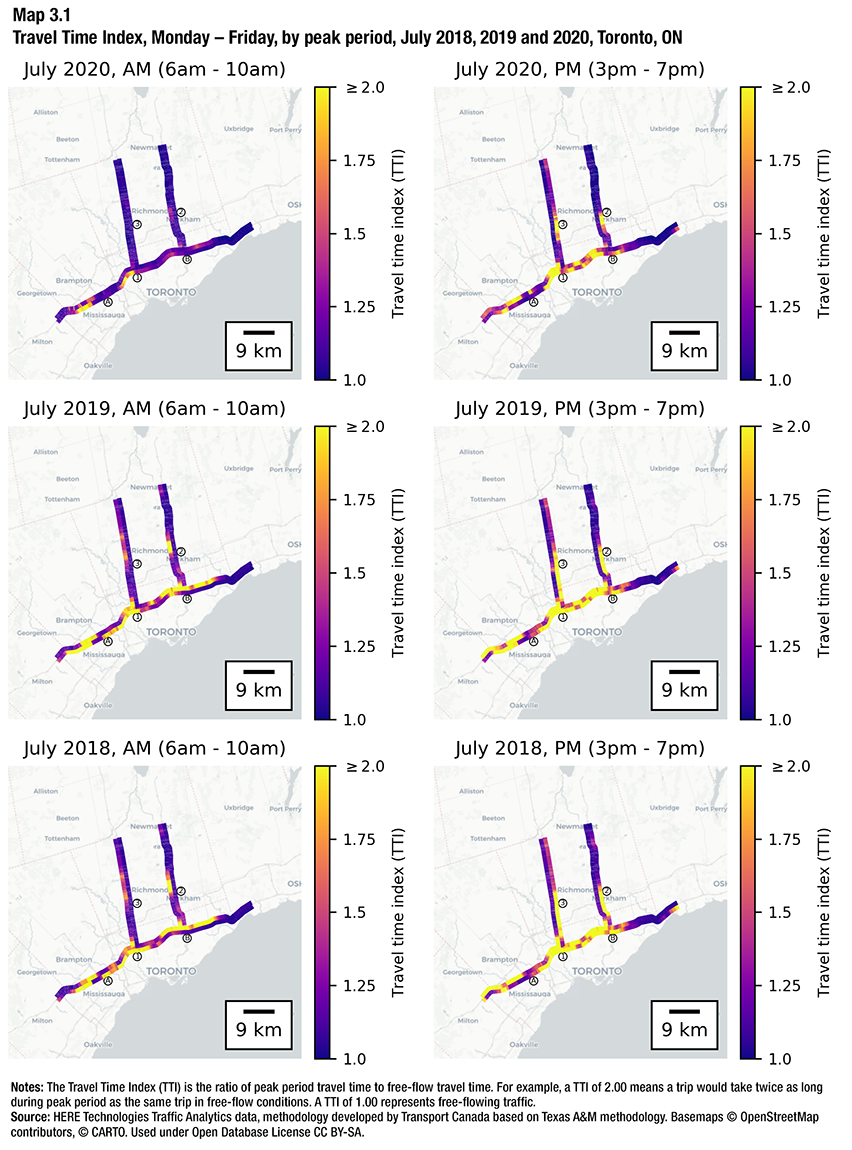
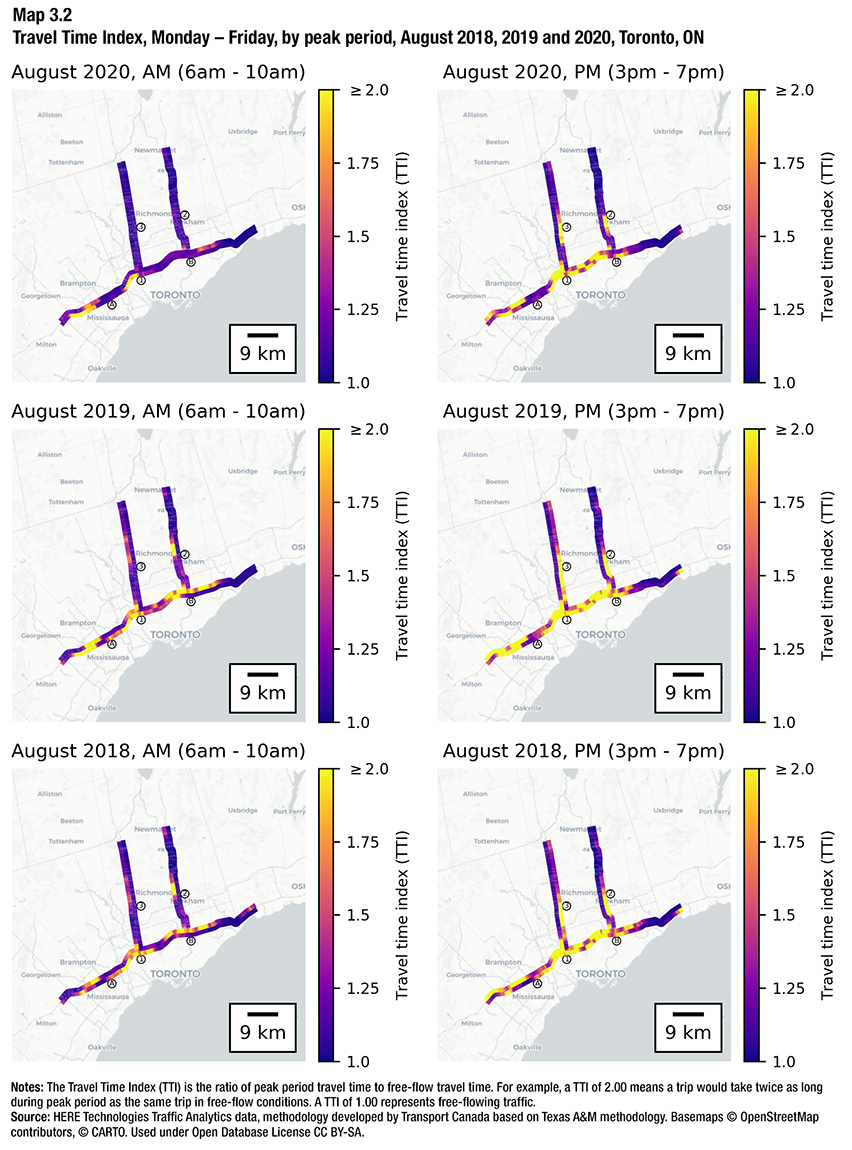
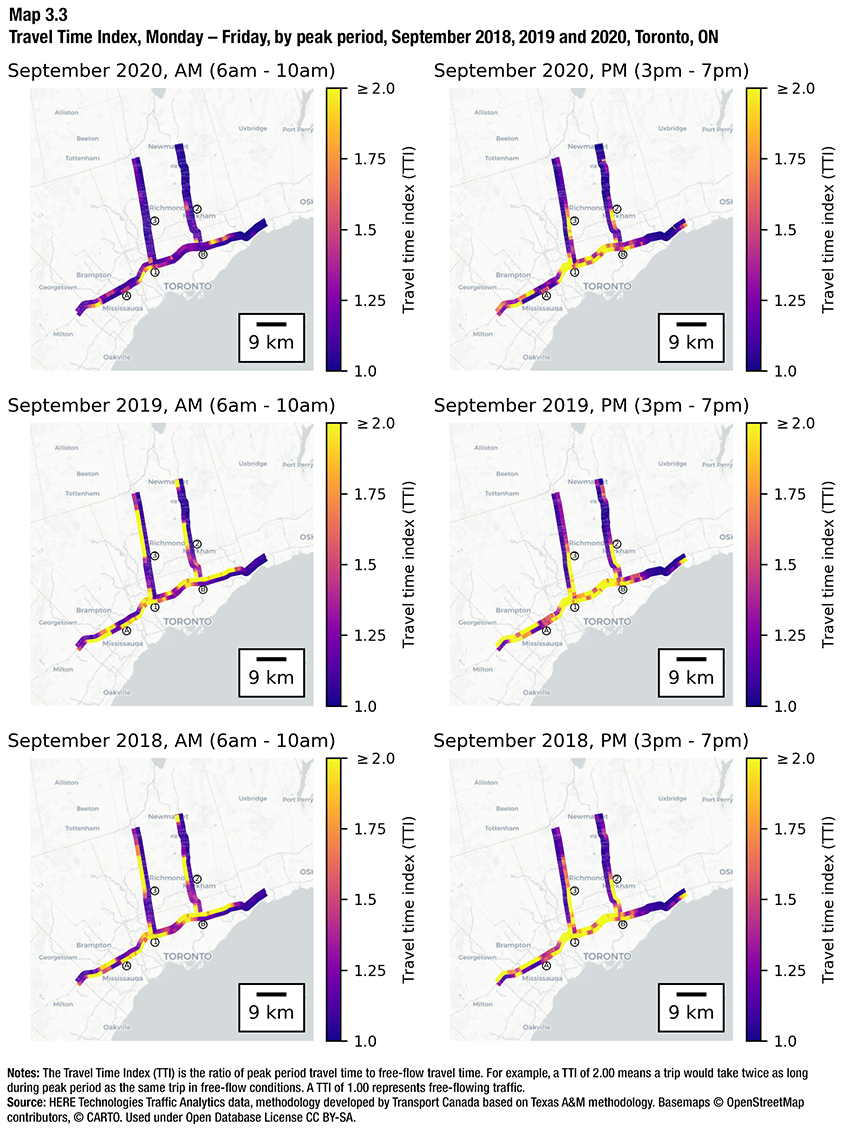
Description for Maps 3.1, 3.2 and 3.3
The maps of Toronto each contain five corridors:
- Corridor 1 col A corresponds to the collector lanes of highway 401 between highway 427 in the east and Creditview Rd in the west. Its approximate length is 12.5 kilometres.
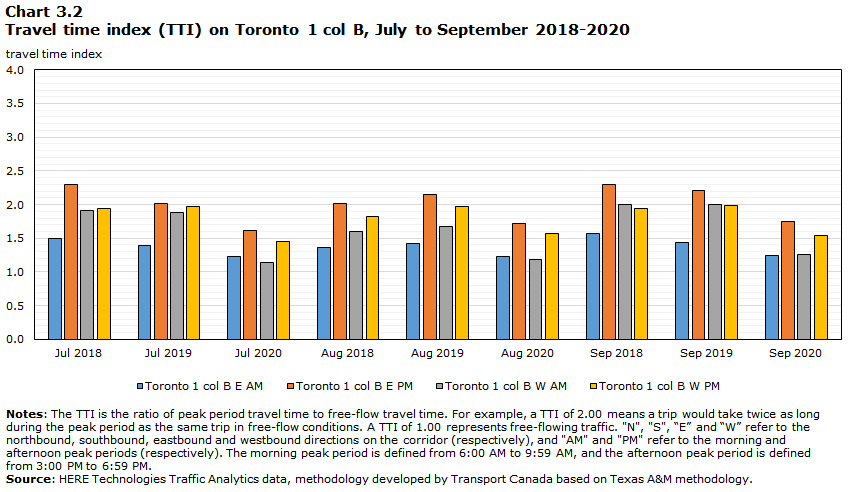
- Corridor 1 col B corresponds to the collector lanes of highway 401 between Brock Rd (Pickering) in the east and highway 409 in the west. Its approximate length is 43.5 kilometres.
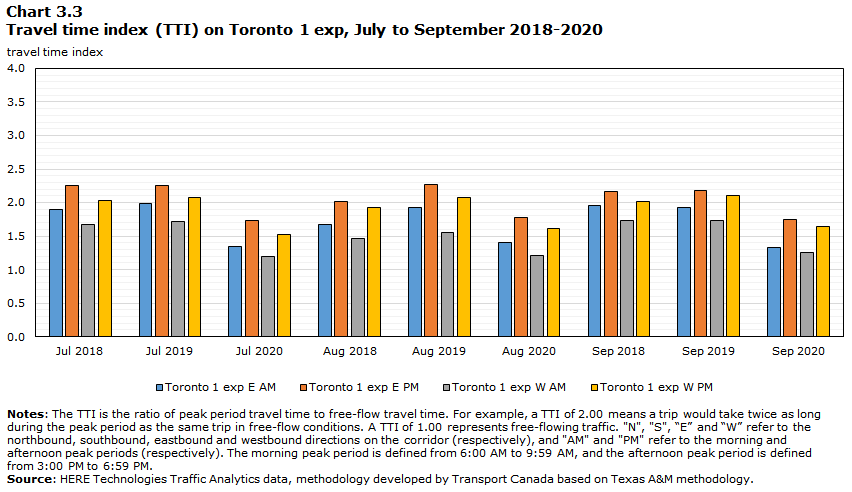
- Corridor 1 exp corresponds to the express lanes of highway 401 between Brock Rd (Pickering) in the east and Trafalgar Rd in the west. Its approximate length is 71 kilometres.
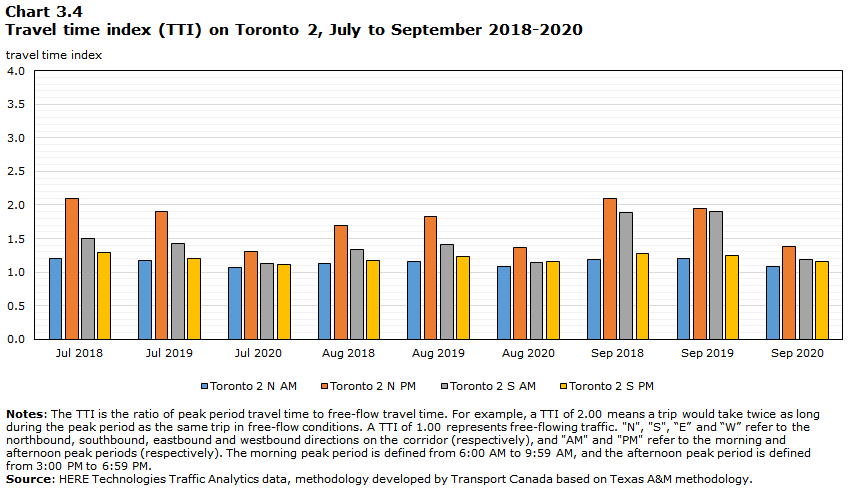
- Corridor 2 corresponds to highway 404 between Davis Dr (Newmarket) in the north and highway 401 in the south. Its approximate length is 34.5 kilometres.
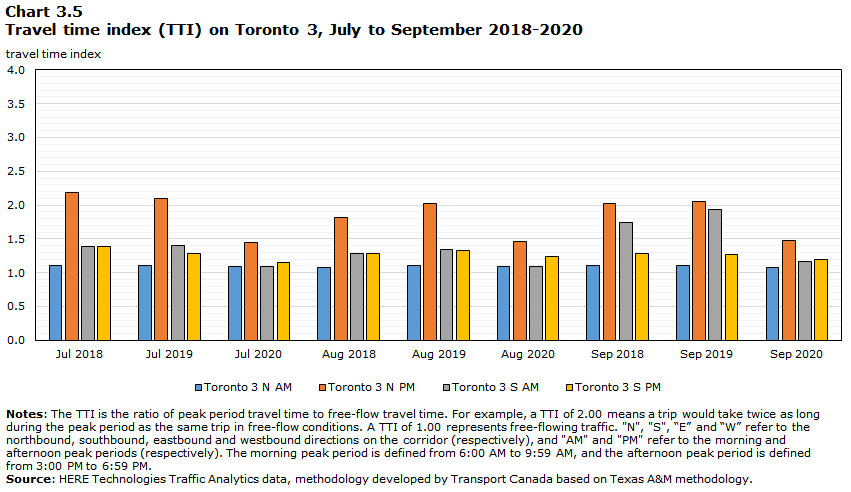
- Corridor 3 corresponds to highway 400 between highway 9 in the north and highway 401 in the south. Its approximate length is 35 kilometres.
Each corridor is colour-coded to represent travel time index along its length. The dark purple colour represents a travel time index of 1.00 and the bright yellow colour represents a travel time index of 2.00 or greater. The aggregated corridor-level travel time index is shown in the table below.
Notes: The Travel Time Index (TTI) is the ratio of peak period travel time to free-flow travel time. For example, a TTI of 2.00 means a trip would take twice as long during peak period as the same trip in free-flow conditions. A TTI of 1.00 represents free-flowing traffic.
Source: HERE Technologies Traffic Analytics data, methodology developed by Transport Canada based on Texas A&M methodology. Basemaps © OpenStreetMap contributors, © CARTO. Used under Open Database License CC BY-SA.
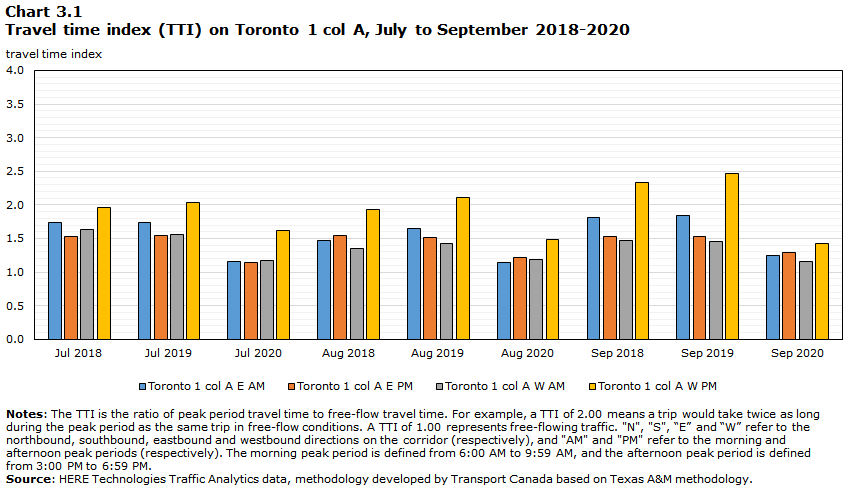
Data table for Charts 3.1, 3.2, 3.3, 3.4 and 3.5
| Corridor | Direction | Peak period | Jul 2018 | Jul 2019 | Jul 2020 | Aug 2018 | Aug 2019 | Aug 2020 | Sep 2018 | Sep 2019 | Sep 2020 |
|---|---|---|---|---|---|---|---|---|---|---|---|
| Toronto col 1 A | E | AM | 1.73 | 1.73 | 1.16 | 1.47 | 1.65 | 1.14 | 1.81 | 1.84 | 1.25 |
| PM | 1.53 | 1.54 | 1.15 | 1.55 | 1.51 | 1.21 | 1.52 | 1.54 | 1.28 | ||
| W | AM | 1.63 | 1.56 | 1.17 | 1.34 | 1.42 | 1.19 | 1.48 | 1.45 | 1.16 | |
| PM | 1.96 | 2.03 | 1.62 | 1.93 | 2.11 | 1.48 | 2.34 | 2.47 | 1.43 | ||
| Toronto col 1 B | E | AM | 1.50 | 1.40 | 1.23 | 1.37 | 1.42 | 1.23 | 1.57 | 1.43 | 1.24 |
| PM | 2.30 | 2.02 | 1.62 | 2.02 | 2.16 | 1.71 | 2.30 | 2.21 | 1.74 | ||
| W | AM | 1.91 | 1.88 | 1.14 | 1.60 | 1.68 | 1.19 | 2.00 | 2.00 | 1.26 | |
| PM | 1.94 | 1.96 | 1.45 | 1.82 | 1.98 | 1.57 | 1.93 | 1.99 | 1.54 | ||
| Toronto 1 exp | E | AM | 1.89 | 1.98 | 1.34 | 1.67 | 1.93 | 1.40 | 1.95 | 1.92 | 1.32 |
| PM | 2.26 | 2.26 | 1.73 | 2.02 | 2.27 | 1.78 | 2.16 | 2.18 | 1.75 | ||
| W | AM | 1.67 | 1.72 | 1.19 | 1.46 | 1.56 | 1.21 | 1.72 | 1.74 | 1.25 | |
| PM | 2.03 | 2.07 | 1.52 | 1.93 | 2.08 | 1.61 | 2.01 | 2.10 | 1.65 | ||
| Toronto 2 | N | AM | 1.20 | 1.18 | 1.08 | 1.12 | 1.16 | 1.08 | 1.19 | 1.20 | 1.09 |
| PM | 2.09 | 1.90 | 1.31 | 1.70 | 1.83 | 1.36 | 2.09 | 1.94 | 1.38 | ||
| S | AM | 1.51 | 1.42 | 1.13 | 1.34 | 1.41 | 1.14 | 1.89 | 1.90 | 1.19 | |
| PM | 1.30 | 1.20 | 1.11 | 1.17 | 1.23 | 1.15 | 1.28 | 1.25 | 1.16 | ||
| Toronto 3 | N | AM | 1.10 | 1.11 | 1.08 | 1.08 | 1.11 | 1.09 | 1.10 | 1.10 | 1.08 |
| PM | 2.18 | 2.10 | 1.44 | 1.82 | 2.02 | 1.46 | 2.02 | 2.06 | 1.48 | ||
| S | AM | 1.38 | 1.40 | 1.09 | 1.28 | 1.34 | 1.10 | 1.75 | 1.93 | 1.17 | |
| PM | 1.38 | 1.28 | 1.15 | 1.29 | 1.32 | 1.24 | 1.29 | 1.27 | 1.20 | ||
| Notes: The TTI is the ratio of peak period travel time to free-flow travel time. For example, a TTI of 2.00 means a trip would take twice as long during the peak period as the same trip in free-flow conditions. A TTI of 1.00 represents free-flowing traffic. "N", "S", “E” and “W” refer to the northbound, southbound, eastbound and westbound directions on the corridor (respectively), and "AM" and "PM" refer to the morning and afternoon peak periods (respectively). The morning peak period is defined from 6:00 AM to 9:59 AM, and the afternoon peak period is defined from 3:00 PM to 6:59 PM. Source: HERE Technologies Traffic Analytics data, methodology developed by Transport Canada based on Texas A&M methodology. |