Urban Mobility: Performance Indicators, Transport Canada
Urban Mobility: Performance Indicators, Transport Canada Super AdminUrban mobility refers to a person’s ability to move around the city where they live and work. Congestion on city roads reduces mobility, which is not only an individual inconvenience but also has an economic impact. While the amount of additional time spent in traffic, excess fuel consumed, and other costs of congestion may be large in Canada, the full impact is not known. Using key indicators to evaluate congestion, its cost, and its impact on the economy is the first step to understanding the magnitude of the problem.
To that end, Transport Canada is now using a key mobility indicator - the travel time index or TTI - to track the performance of a series of key urban trade corridors across Canada. Put simply, the TTI is the ratio of actual travel time to the ideal or “free-flow” travel time or, equivalently, the ratio of free-flow speed to actual speed. The travel time index is recommended by the Transportation Association of Canada (TAC) and used by the United States Federal Highway Administration (FHWA).
Key strategic urban trade corridors
Transport Canada and provincial ministries of transport have defined a series of key urban trade corridors in Canada’s largest urban areas. The focus is on travel time during the weekday morning peak from 6:00 to 9:59 AM and afternoon peak from 3:00 to 6:59 PM. Note that holidays were not removed from the analysis. The TTI is displayed on maps, in tables and graphically.
Link versus corridor travel times
A corridor consists of a series of links which vary in length from approximately 20 meters to 2 kilometers. A link refers to a specific section of road, such as the length of a city block between two intersections or the stretch of highway between two on- and off-ramps. The TTI can be presented at the link level with a separate value associated to each link for a given month. This format makes it simple to visualize bottlenecks on a corridor and how the index varies over the corridor during a given month. However, link values are more difficult to compare from one month to another.
The TTI can also be presented at the corridor level in tabular and graphical form, but only for a single value per peak period in each direction. To compute a corridor index, the TTI link values along a corridor are aggregated in a way that accounts for traffic volume; for example, a longer and more heavily travelled link contributes more weight. Thus, a single TTI value is calculated for weekday morning and weekday afternoon peak periods per direction on each corridor. While this corridor level allows for an easy month to month comparison, the single value for each peak period will mask traffic details along the corridor, such as locations of bottlenecks for example. In some cases the aggregated value is close to 1.00, as high values are simply off-set by low values.
Products
The TTI is available in three formats - maps, tables and charts - each having advantages and limitations. The data used to calculate the indices are supplied by HERE Technologies, a business which collects detailed speed data from Canada’s entire road network. The data remain anonymous as vehicle speeds are combined into links and time bins, and available within days of collection.
Vancouver
Vancouver Super AdminMaps of Vancouver show four corridors: Highway 99, Highway 91, Highway 17, and Highway 1, with travel time index (TTI) data color-coded for each corridor.
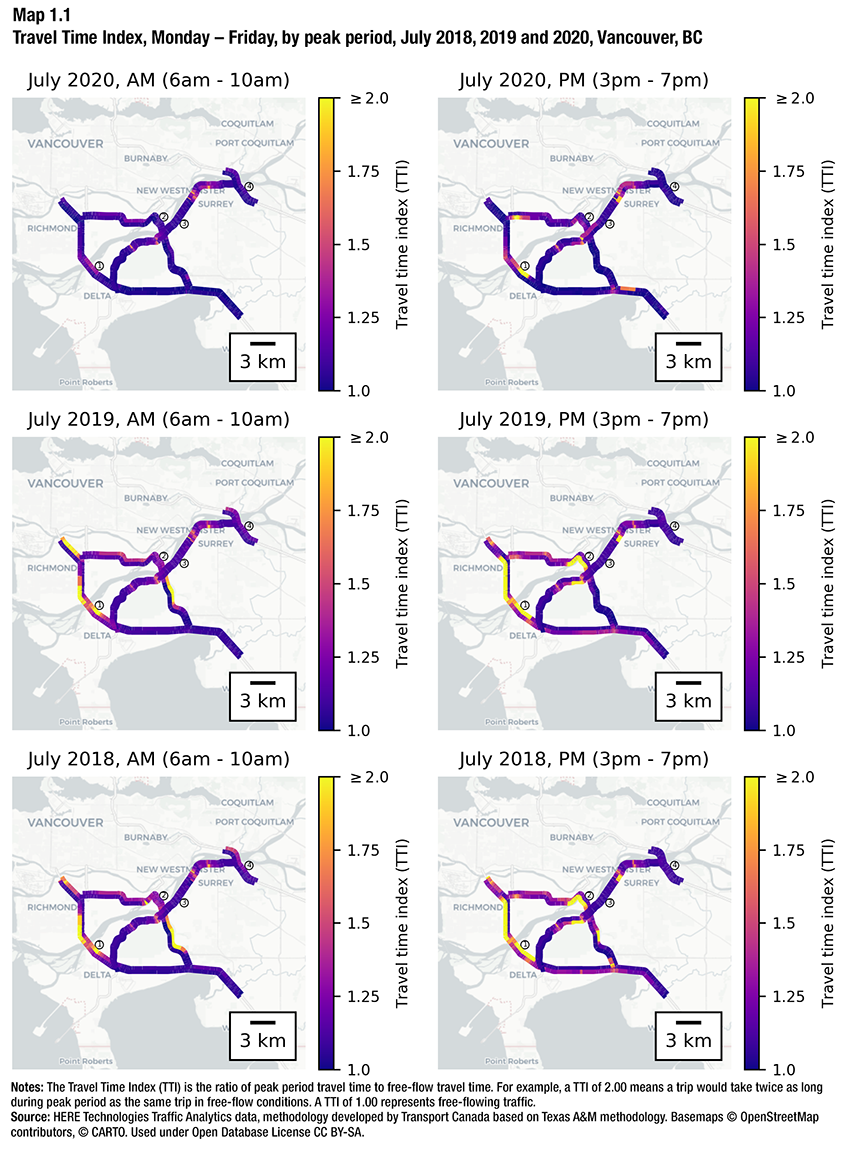
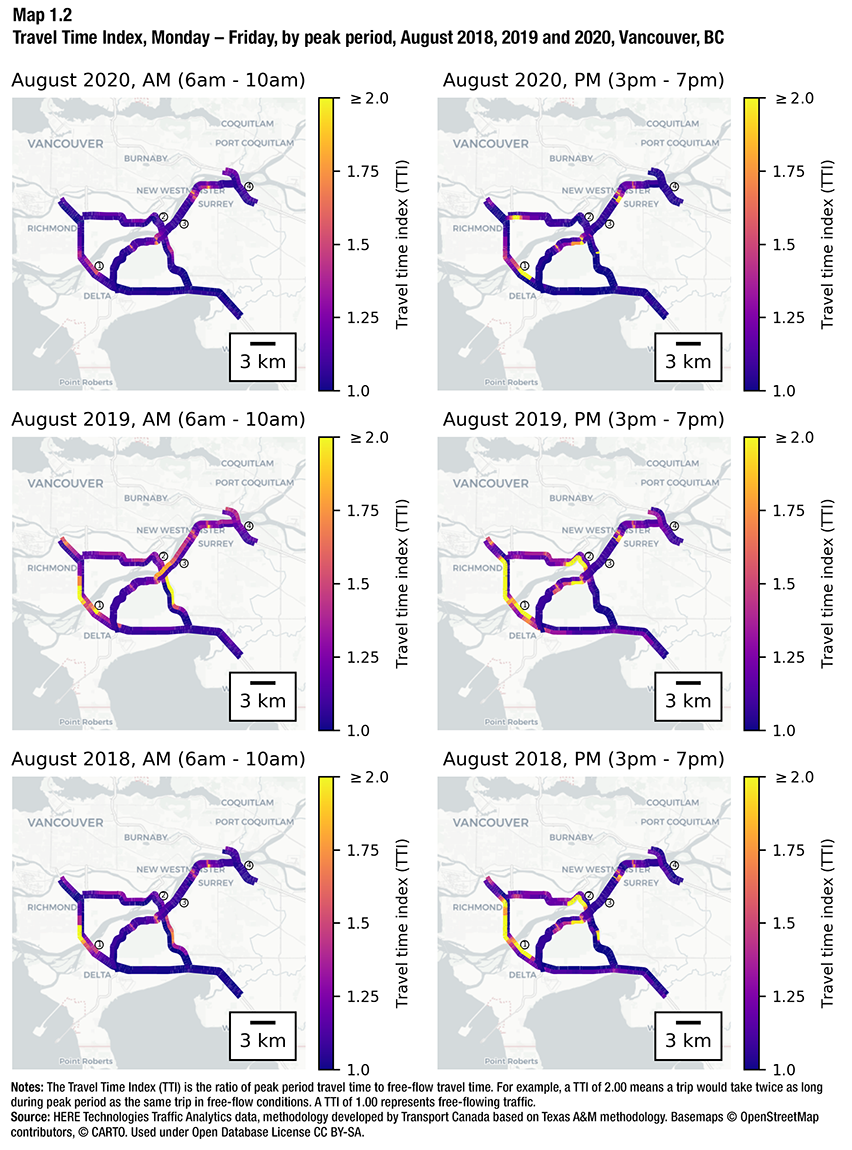
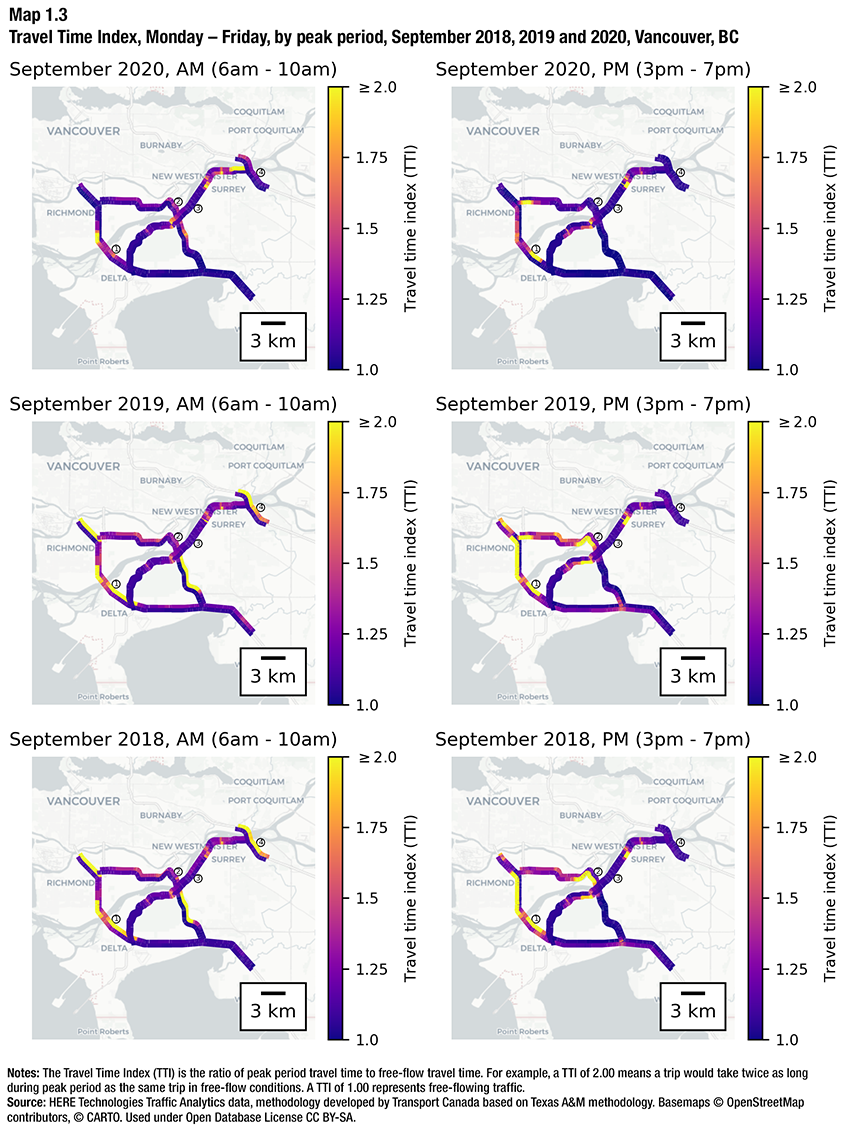
Description for Maps 1.1, 1.2 and 1.3
The maps of Vancouver each contain four corridors:
- Corridor 1 corresponds to highway 99 between Van Horne Way in the north and 32nd Avenue Diversion in the south. Its approximate length is 32 kilometres.
- Corridor 2 corresponds to highway 91 between No. 5 Rd in the north and highway 99 in the south. Its approximate length is 21.5 kilometres.
- Corridor 3 corresponds to highway 17 between highway 1 in the east and Ladner Trunk Rd in the west. Its approximate length is 24 kilometres.
- Corridor 4 corresponds to highway 1 between Fawcett Rd in the north and 160 St in the south. Its approximate length is 6 kilometres.
Each corridor is colour-coded to represent travel time index along its length. The dark purple colour represents a travel time index of 1.00 and the bright yellow colour represents a travel time index of 2.00 or greater. The aggregated corridor-level travel time index is shown in the table below.
Notes: The Travel Time Index (TTI) is the ratio of peak period travel time to free-flow travel time. For example, a TTI of 2.00 means a trip would take twice as long during peak period as the same trip in free-flow conditions. A TTI of 1.00 represents free-flowing traffic.
Source: HERE Technologies Traffic Analytics data, methodology developed by Transport Canada based on Texas A&M methodology. Basemaps © OpenStreetMap contributors, © CARTO. Used under Open Database License CC BY-SA.
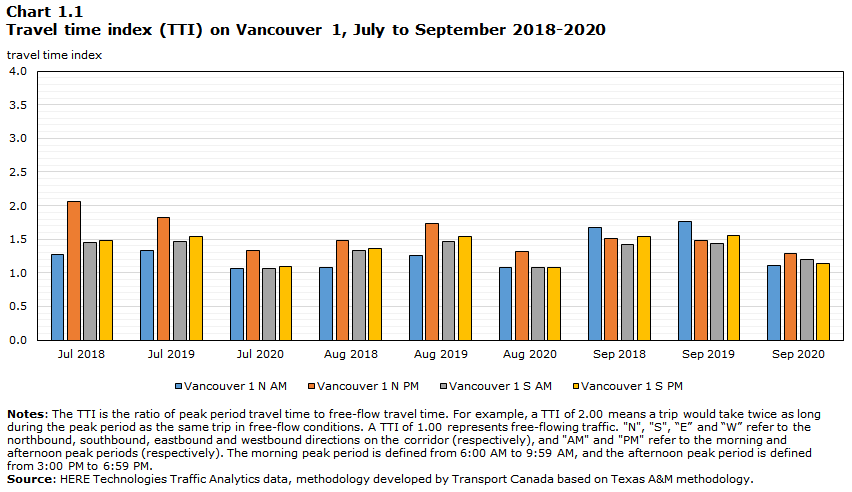
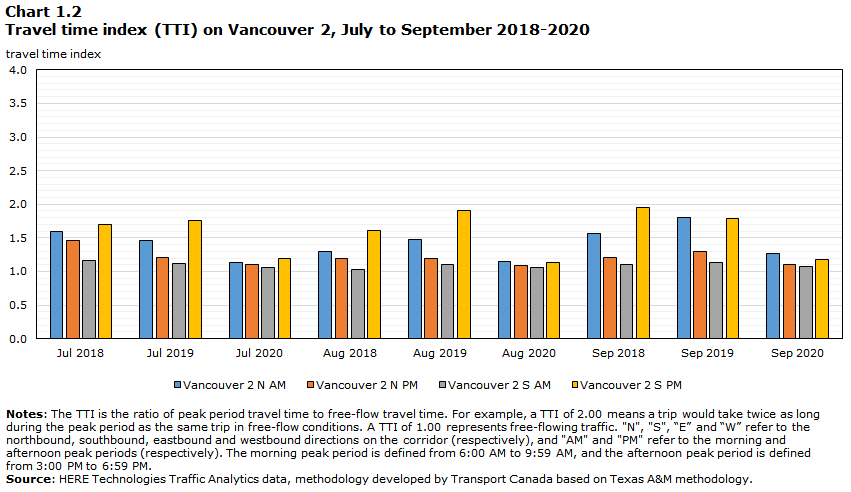
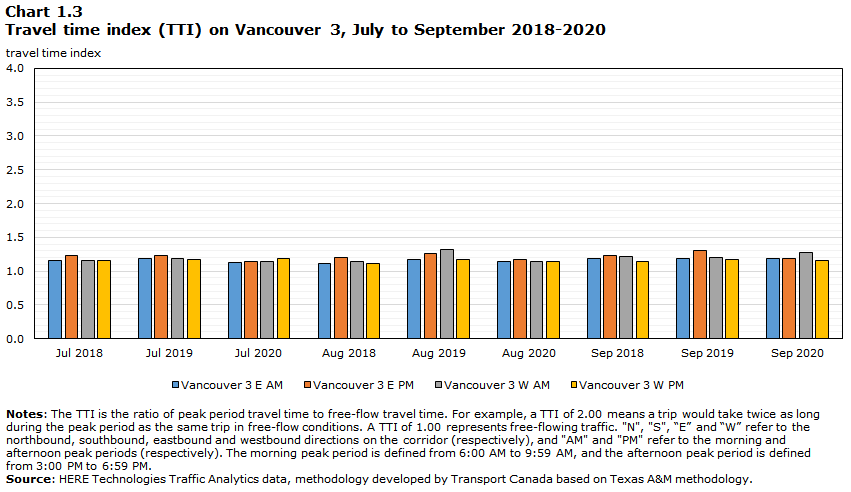
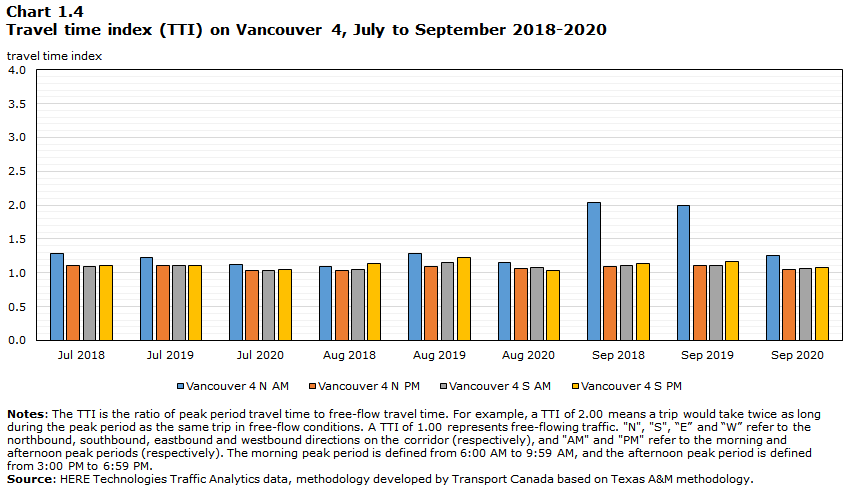
Data table for Charts 1.1, 1.2, 1.3 and 1.4
| Corridor | Direction | Peak period | Jul 2018 | Jul 2019 | Jul 2020 | Aug 2018 | Aug 2019 | Aug 2020 | Sep 2018 | Sep 2019 | Sep 2020 |
|---|---|---|---|---|---|---|---|---|---|---|---|
| Vancouver 1 | N | AM | 1.27 | 1.33 | 1.07 | 1.09 | 1.26 | 1.08 | 1.68 | 1.76 | 1.11 |
| PM | 2.06 | 1.82 | 1.33 | 1.48 | 1.73 | 1.31 | 1.52 | 1.48 | 1.28 | ||
| S | AM | 1.46 | 1.46 | 1.06 | 1.33 | 1.47 | 1.09 | 1.42 | 1.44 | 1.19 | |
| PM | 1.49 | 1.55 | 1.10 | 1.36 | 1.54 | 1.08 | 1.54 | 1.56 | 1.14 | ||
| Vancouver 2 | N | AM | 1.59 | 1.45 | 1.13 | 1.29 | 1.48 | 1.15 | 1.57 | 1.81 | 1.27 |
| PM | 1.46 | 1.21 | 1.10 | 1.20 | 1.19 | 1.09 | 1.21 | 1.29 | 1.10 | ||
| S | AM | 1.16 | 1.12 | 1.06 | 1.03 | 1.11 | 1.07 | 1.10 | 1.13 | 1.07 | |
| PM | 1.70 | 1.76 | 1.19 | 1.61 | 1.91 | 1.13 | 1.95 | 1.78 | 1.18 | ||
| Vancouver 3 | E | AM | 1.15 | 1.18 | 1.13 | 1.12 | 1.17 | 1.14 | 1.18 | 1.18 | 1.19 |
| PM | 1.23 | 1.23 | 1.15 | 1.21 | 1.25 | 1.17 | 1.23 | 1.30 | 1.18 | ||
| W | AM | 1.16 | 1.19 | 1.14 | 1.14 | 1.32 | 1.14 | 1.22 | 1.20 | 1.28 | |
| PM | 1.15 | 1.17 | 1.19 | 1.12 | 1.17 | 1.14 | 1.14 | 1.18 | 1.16 | ||
| Vancouver 4 | N | AM | 1.28 | 1.23 | 1.12 | 1.10 | 1.29 | 1.15 | 2.05 | 2.00 | 1.25 |
| PM | 1.10 | 1.10 | 1.04 | 1.04 | 1.09 | 1.06 | 1.09 | 1.11 | 1.05 | ||
| S | AM | 1.09 | 1.10 | 1.04 | 1.05 | 1.16 | 1.07 | 1.11 | 1.11 | 1.06 | |
| PM | 1.11 | 1.10 | 1.06 | 1.13 | 1.23 | 1.04 | 1.13 | 1.16 | 1.07 | ||
| Notes: The TTI is the ratio of peak period travel time to free-flow travel time. For example, a TTI of 2.00 means a trip would take twice as long during the peak period as the same trip in free-flow conditions. A TTI of 1.00 represents free-flowing traffic. "N", "S", “E” and “W” refer to the northbound, southbound, eastbound and westbound directions on the corridor (respectively), and "AM" and "PM" refer to the morning and afternoon peak periods (respectively). The morning peak period is defined from 6:00 AM to 9:59 AM, and the afternoon peak period is defined from 3:00 PM to 6:59 PM. Source: HERE Technologies Traffic Analytics data, methodology developed by Transport Canada based on Texas A&M methodology. |
Calgary
Calgary Super AdminMaps of Calgary show three corridors: Highway 2, Highway 201, and Highway 1, with travel time index (TTI) data color-coded for each corridor.
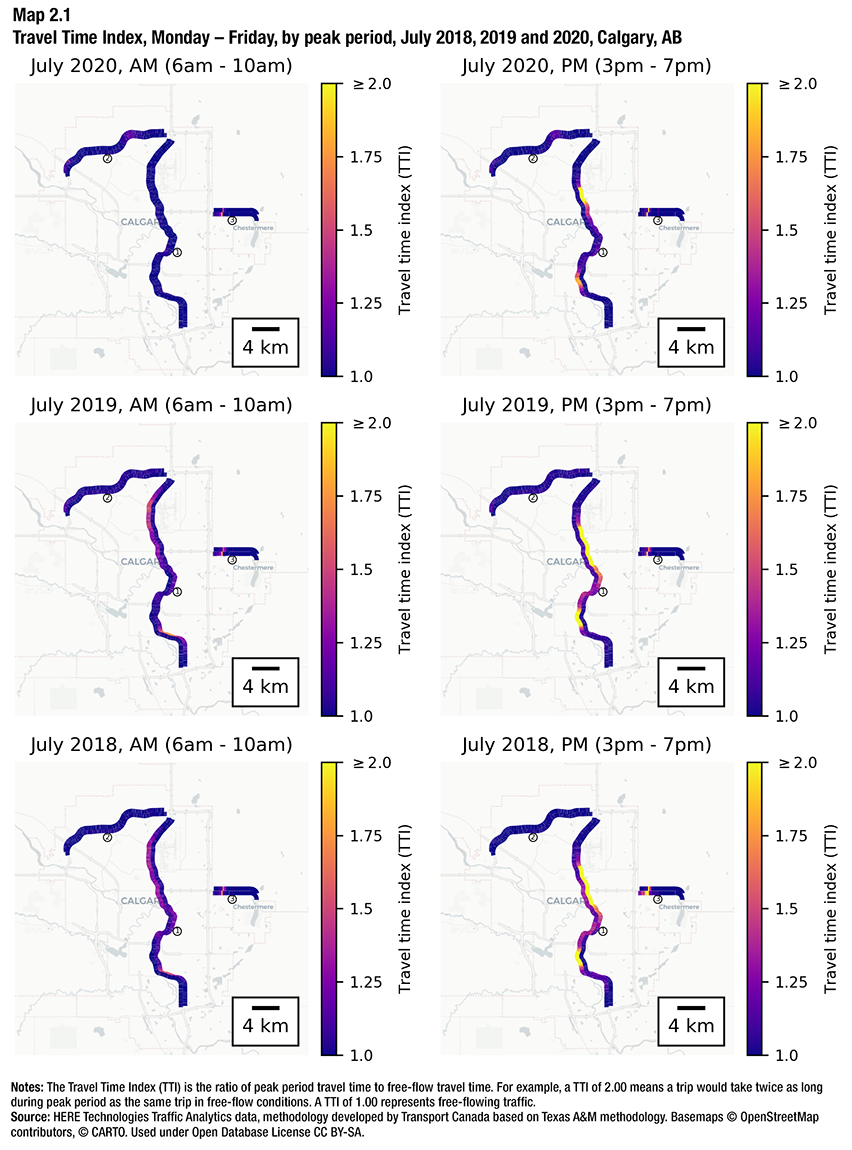
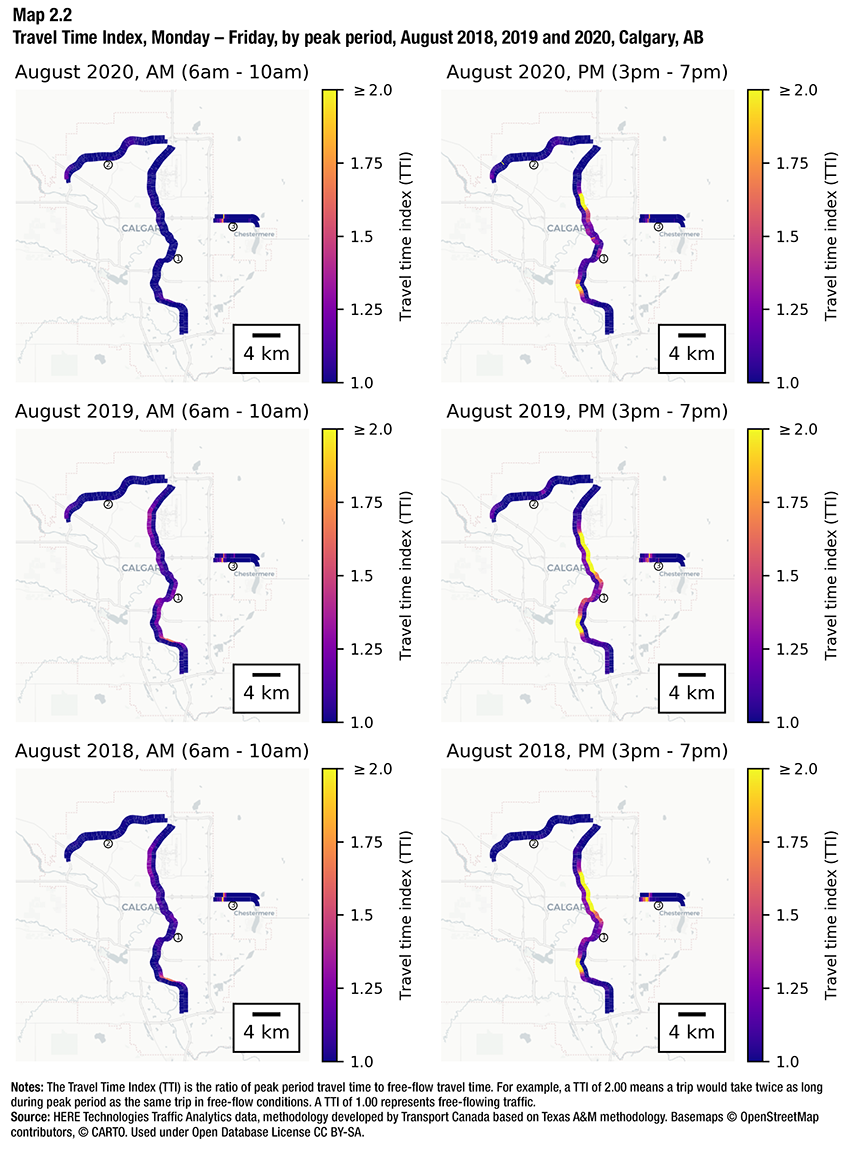
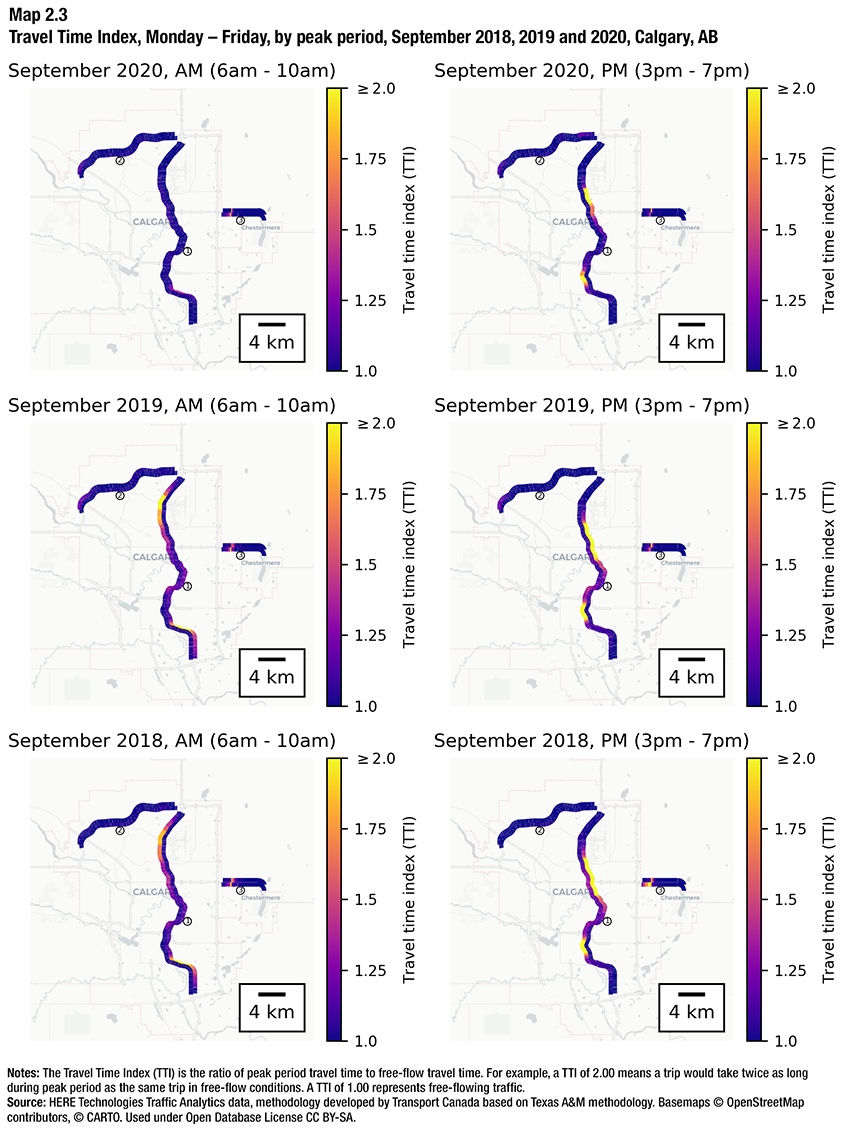
Description for Maps 2.1, 2.2 and 2.3
The maps of Calgary each contain three corridors:
- Corridor 1 corresponds to highway 2 between highway 201 N in the north and highway 201 S in the south. Its approximate length is 36.5 kilometres.
- Corridor 2 corresponds to highway 201 between highway 2 in the east and Scenic Acres Link in the west. Its approximate length is 19 kilometres.
- Corridor 3 corresponds to highway 1 between highway 1A (Chestermere) in the east and highway 201 E in the west. Its approximate length is 8.5 kilometres.
Each corridor is colour-coded to represent travel time index along its length. The dark purple colour represents a travel time index of 1.00 and the bright yellow colour represents a travel time index of 2.00 or greater. The aggregated corridor-level travel time index is shown in the table below.
Notes: The Travel Time Index (TTI) is the ratio of peak period travel time to free-flow travel time. For example, a TTI of 2.00 means a trip would take twice as long during peak period as the same trip in free-flow conditions. A TTI of 1.00 represents free-flowing traffic.
Source: HERE Technologies Traffic Analytics data, methodology developed by Transport Canada based on Texas A&M methodology. Basemaps © OpenStreetMap contributors, © CARTO. Used under Open Database License CC BY-SA.
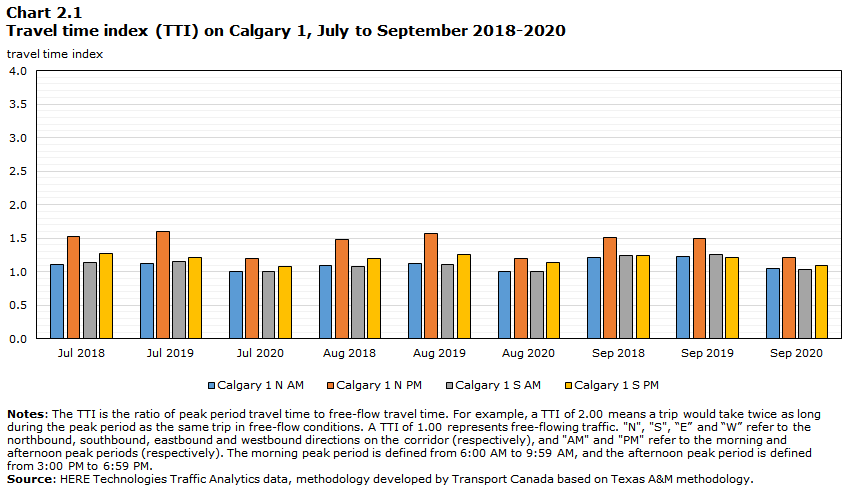
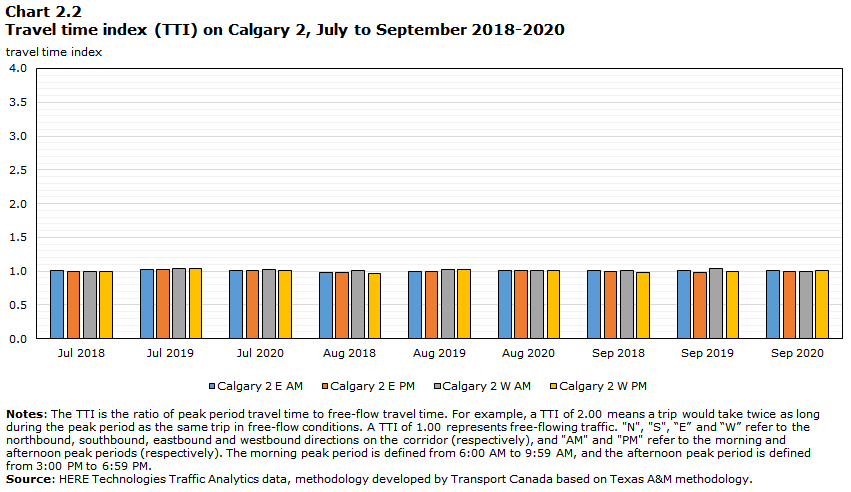
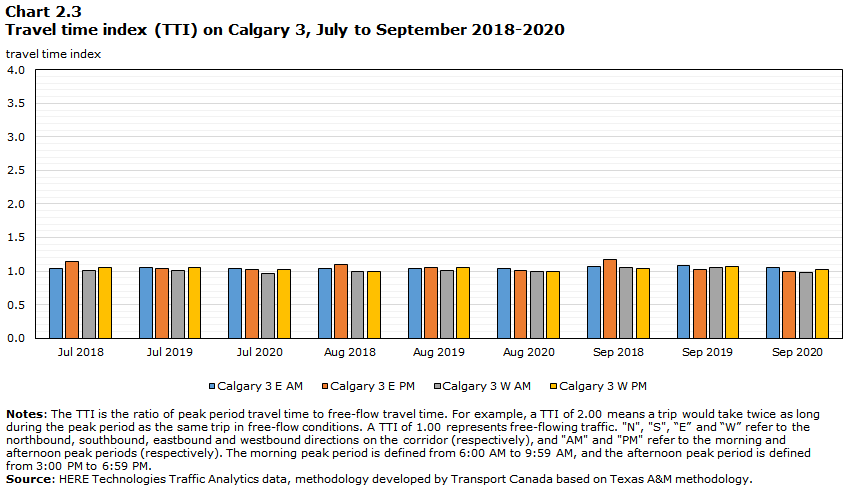
Data table for Charts 2.1, 2.2 and 2.3
| Corridor | Direction | Peak period | Jul 2018 | Jul 2019 | Jul 2020 | Aug 2018 | Aug 2019 | Aug 2020 | Sep 2018 | Sep 2019 | Sep 2020 |
|---|---|---|---|---|---|---|---|---|---|---|---|
| Calgary 1 | N | AM | 1.11 | 1.12 | 1.00 | 1.09 | 1.13 | 1.01 | 1.22 | 1.23 | 1.05 |
| PM | 1.52 | 1.60 | 1.19 | 1.49 | 1.57 | 1.20 | 1.52 | 1.49 | 1.22 | ||
| S | AM | 1.14 | 1.15 | 1.01 | 1.08 | 1.11 | 1.01 | 1.24 | 1.26 | 1.03 | |
| PM | 1.27 | 1.21 | 1.08 | 1.20 | 1.25 | 1.14 | 1.24 | 1.21 | 1.09 | ||
| Calgary 2 | E | AM | 1.00 | 1.02 | 1.02 | 0.98 | 0.99 | 1.01 | 1.01 | 1.01 | 1.00 |
| PM | 1.00 | 1.03 | 1.01 | 0.98 | 1.00 | 1.00 | 1.00 | 0.99 | 1.00 | ||
| W | AM | 1.00 | 1.04 | 1.02 | 1.00 | 1.02 | 1.01 | 1.00 | 1.04 | 1.00 | |
| PM | 0.99 | 1.04 | 1.01 | 0.97 | 1.03 | 1.00 | 0.98 | 1.00 | 1.01 | ||
| Calgary 3 | E | AM | 1.05 | 1.05 | 1.04 | 1.04 | 1.04 | 1.04 | 1.07 | 1.08 | 1.06 |
| PM | 1.15 | 1.03 | 1.03 | 1.10 | 1.05 | 1.00 | 1.18 | 1.03 | 0.99 | ||
| W | AM | 1.01 | 1.02 | 0.97 | 0.99 | 1.01 | 0.99 | 1.05 | 1.05 | 0.98 | |
| PM | 1.05 | 1.06 | 1.03 | 1.00 | 1.06 | 0.99 | 1.04 | 1.06 | 1.02 | ||
| Notes: The TTI is the ratio of peak period travel time to free-flow travel time. For example, a TTI of 2.00 means a trip would take twice as long during the peak period as the same trip in free-flow conditions. A TTI of 1.00 represents free-flowing traffic. "N", "S", “E” and “W” refer to the northbound, southbound, eastbound and westbound directions on the corridor (respectively), and "AM" and "PM" refer to the morning and afternoon peak periods (respectively). The morning peak period is defined from 6:00 AM to 9:59 AM, and the afternoon peak period is defined from 3:00 PM to 6:59 PM. Source: HERE Technologies Traffic Analytics data, methodology developed by Transport Canada based on Texas A&M methodology. |
Toronto
Toronto Super AdminMaps of Toronto show five corridors: Highway 401 collector lanes (two segments), Highway 401 express lanes, Highway 404, and Highway 400, with travel time index (TTI) data color-coded for each corridor.
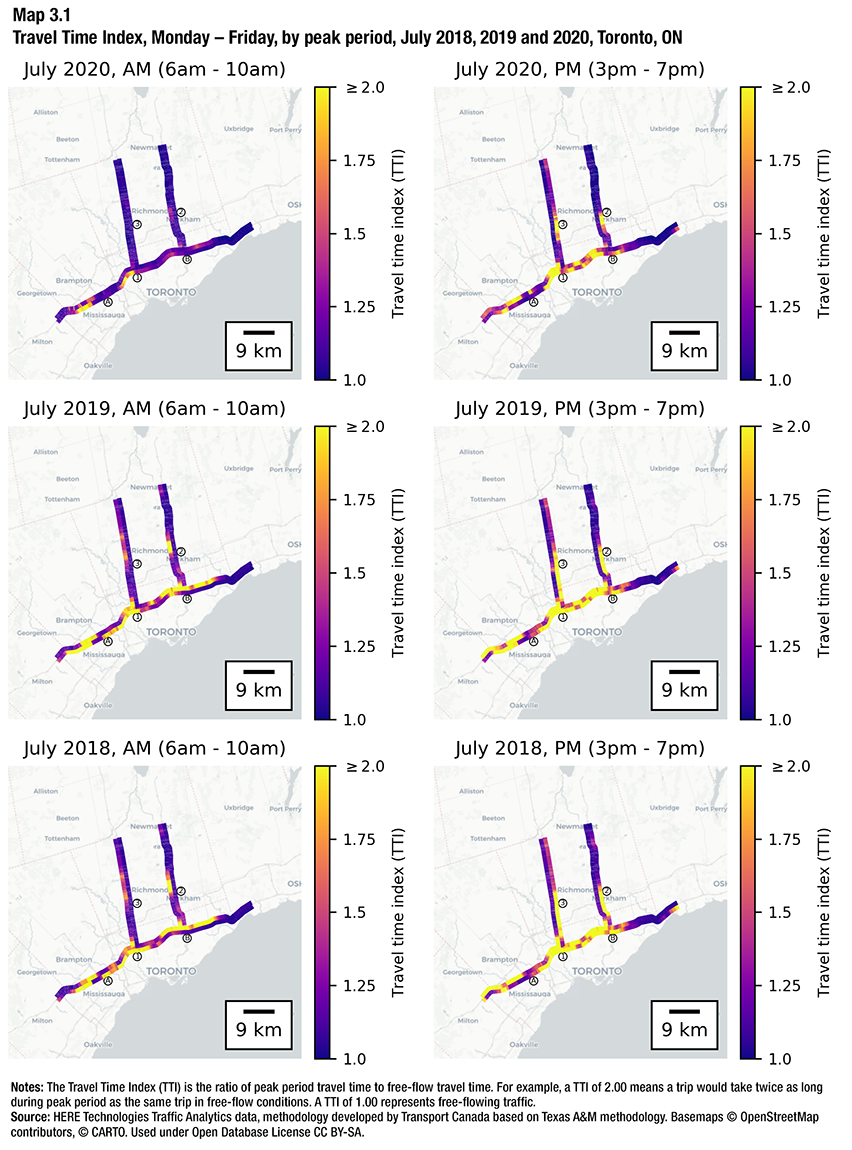
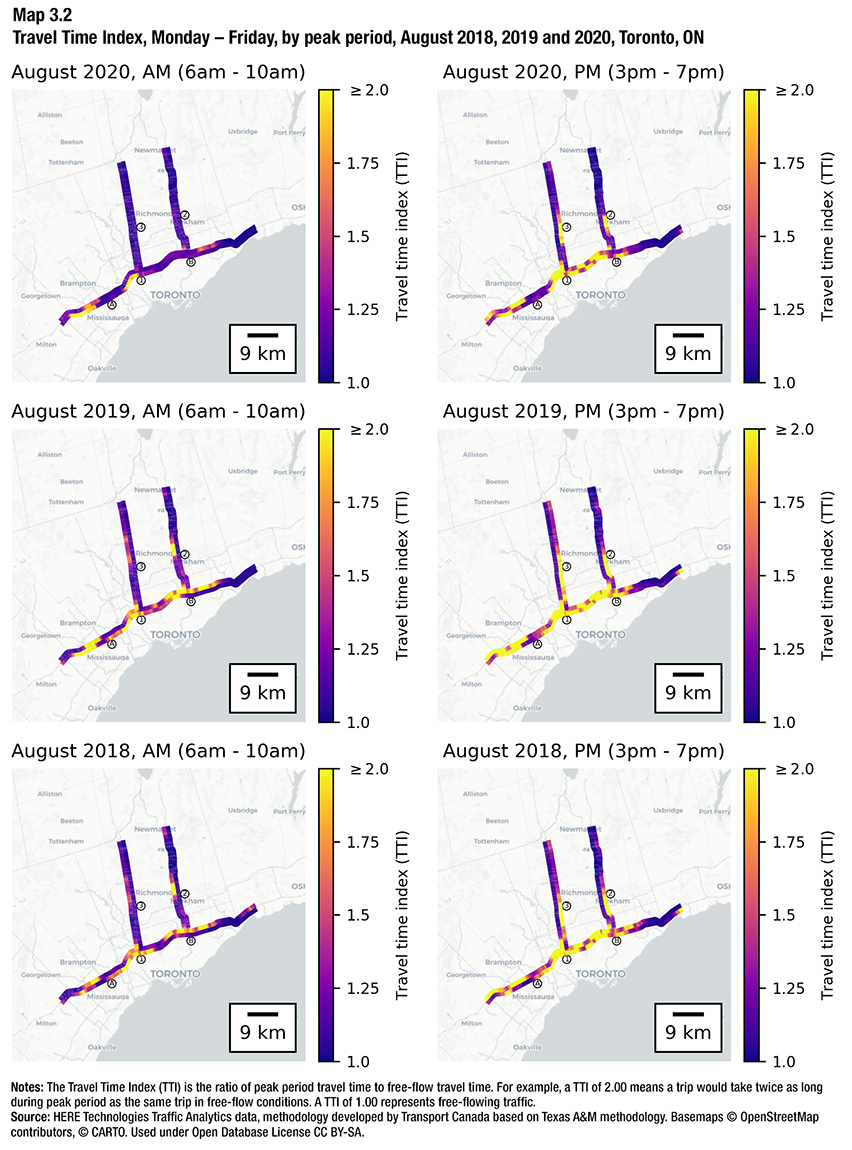
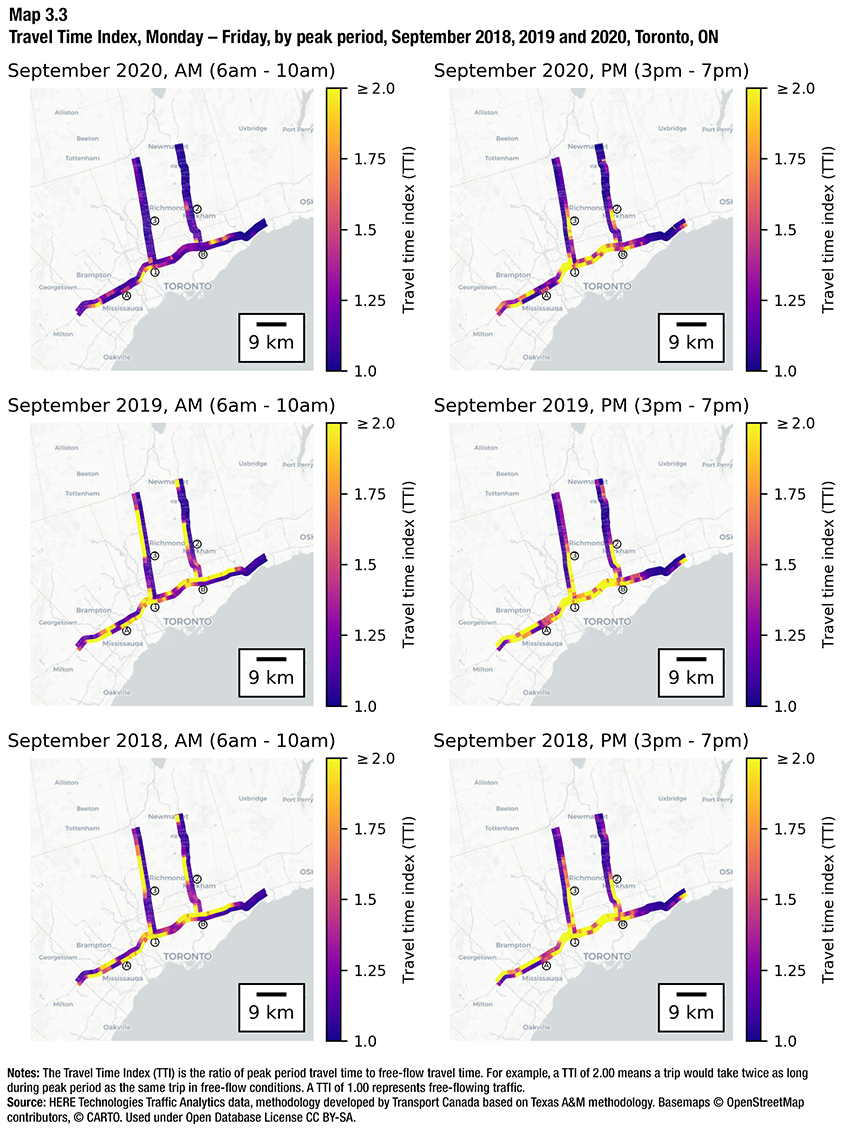
Description for Maps 3.1, 3.2 and 3.3
The maps of Toronto each contain five corridors:
- Corridor 1 col A corresponds to the collector lanes of highway 401 between highway 427 in the east and Creditview Rd in the west. Its approximate length is 12.5 kilometres.
- Corridor 1 col B corresponds to the collector lanes of highway 401 between Brock Rd (Pickering) in the east and highway 409 in the west. Its approximate length is 43.5 kilometres.
- Corridor 1 exp corresponds to the express lanes of highway 401 between Brock Rd (Pickering) in the east and Trafalgar Rd in the west. Its approximate length is 71 kilometres.
- Corridor 2 corresponds to highway 404 between Davis Dr (Newmarket) in the north and highway 401 in the south. Its approximate length is 34.5 kilometres.
- Corridor 3 corresponds to highway 400 between highway 9 in the north and highway 401 in the south. Its approximate length is 35 kilometres.
Each corridor is colour-coded to represent travel time index along its length. The dark purple colour represents a travel time index of 1.00 and the bright yellow colour represents a travel time index of 2.00 or greater. The aggregated corridor-level travel time index is shown in the table below.
Notes: The Travel Time Index (TTI) is the ratio of peak period travel time to free-flow travel time. For example, a TTI of 2.00 means a trip would take twice as long during peak period as the same trip in free-flow conditions. A TTI of 1.00 represents free-flowing traffic.
Source: HERE Technologies Traffic Analytics data, methodology developed by Transport Canada based on Texas A&M methodology. Basemaps © OpenStreetMap contributors, © CARTO. Used under Open Database License CC BY-SA.
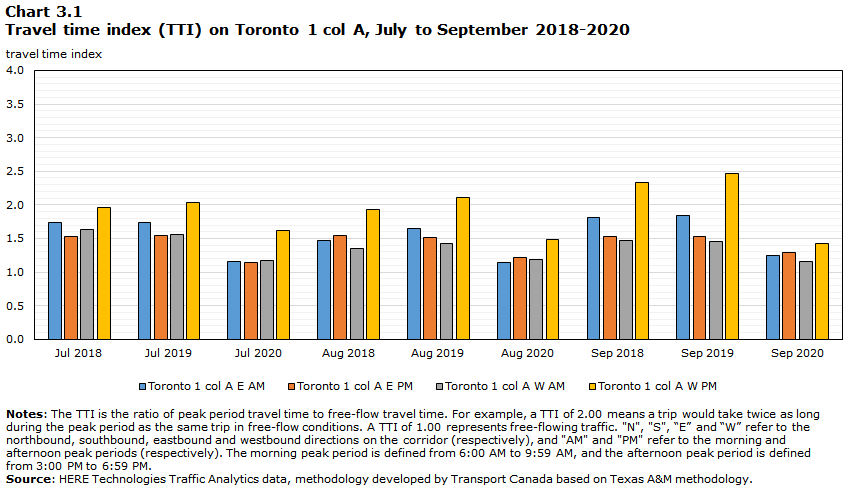
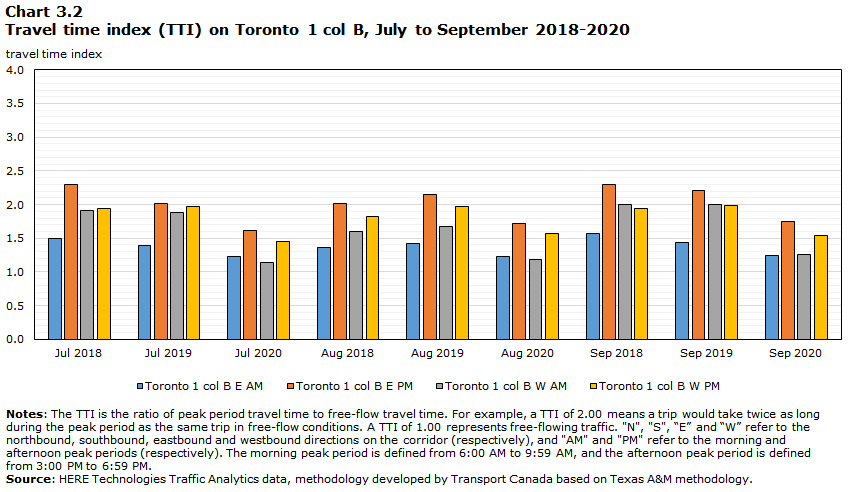
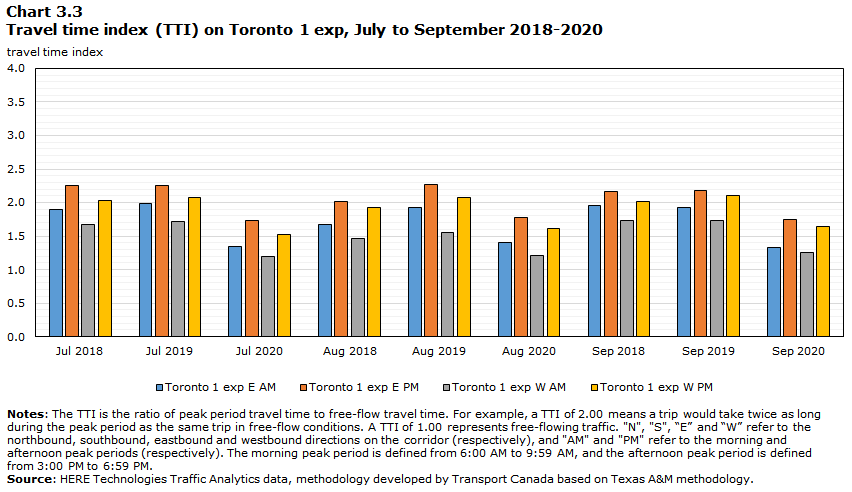
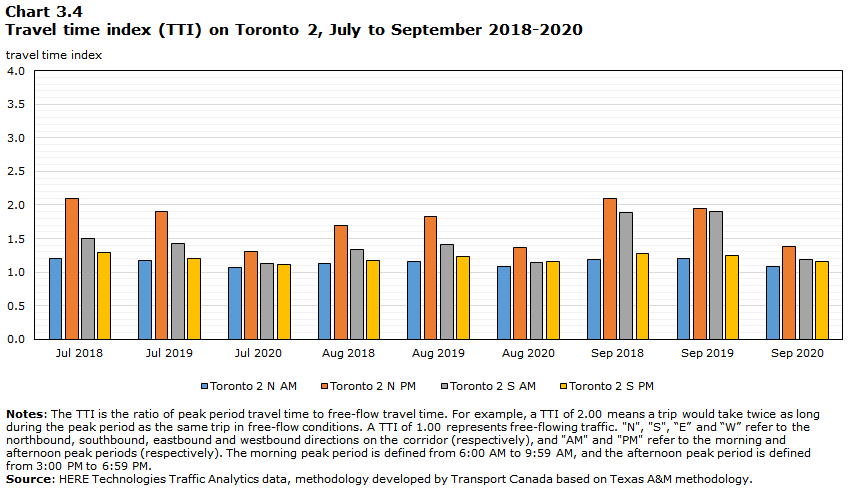
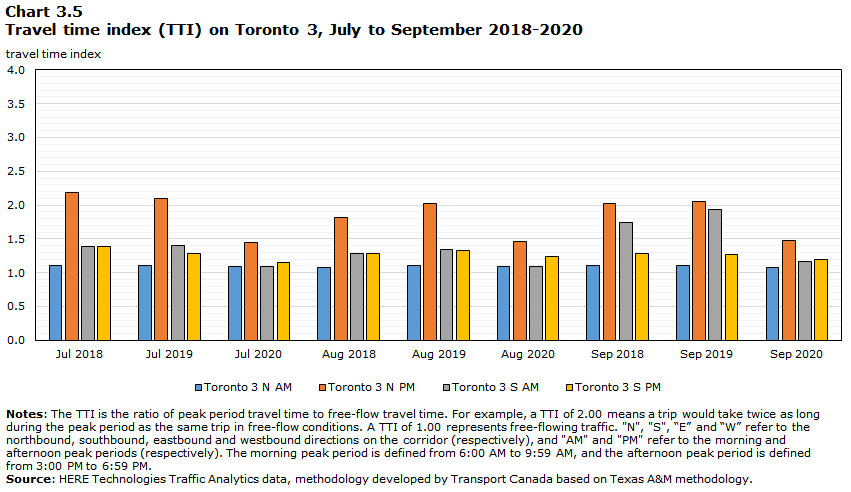
Data table for Charts 3.1, 3.2, 3.3, 3.4 and 3.5
| Corridor | Direction | Peak period | Jul 2018 | Jul 2019 | Jul 2020 | Aug 2018 | Aug 2019 | Aug 2020 | Sep 2018 | Sep 2019 | Sep 2020 |
|---|---|---|---|---|---|---|---|---|---|---|---|
| Toronto col 1 A | E | AM | 1.73 | 1.73 | 1.16 | 1.47 | 1.65 | 1.14 | 1.81 | 1.84 | 1.25 |
| PM | 1.53 | 1.54 | 1.15 | 1.55 | 1.51 | 1.21 | 1.52 | 1.54 | 1.28 | ||
| W | AM | 1.63 | 1.56 | 1.17 | 1.34 | 1.42 | 1.19 | 1.48 | 1.45 | 1.16 | |
| PM | 1.96 | 2.03 | 1.62 | 1.93 | 2.11 | 1.48 | 2.34 | 2.47 | 1.43 | ||
| Toronto col 1 B | E | AM | 1.50 | 1.40 | 1.23 | 1.37 | 1.42 | 1.23 | 1.57 | 1.43 | 1.24 |
| PM | 2.30 | 2.02 | 1.62 | 2.02 | 2.16 | 1.71 | 2.30 | 2.21 | 1.74 | ||
| W | AM | 1.91 | 1.88 | 1.14 | 1.60 | 1.68 | 1.19 | 2.00 | 2.00 | 1.26 | |
| PM | 1.94 | 1.96 | 1.45 | 1.82 | 1.98 | 1.57 | 1.93 | 1.99 | 1.54 | ||
| Toronto 1 exp | E | AM | 1.89 | 1.98 | 1.34 | 1.67 | 1.93 | 1.40 | 1.95 | 1.92 | 1.32 |
| PM | 2.26 | 2.26 | 1.73 | 2.02 | 2.27 | 1.78 | 2.16 | 2.18 | 1.75 | ||
| W | AM | 1.67 | 1.72 | 1.19 | 1.46 | 1.56 | 1.21 | 1.72 | 1.74 | 1.25 | |
| PM | 2.03 | 2.07 | 1.52 | 1.93 | 2.08 | 1.61 | 2.01 | 2.10 | 1.65 | ||
| Toronto 2 | N | AM | 1.20 | 1.18 | 1.08 | 1.12 | 1.16 | 1.08 | 1.19 | 1.20 | 1.09 |
| PM | 2.09 | 1.90 | 1.31 | 1.70 | 1.83 | 1.36 | 2.09 | 1.94 | 1.38 | ||
| S | AM | 1.51 | 1.42 | 1.13 | 1.34 | 1.41 | 1.14 | 1.89 | 1.90 | 1.19 | |
| PM | 1.30 | 1.20 | 1.11 | 1.17 | 1.23 | 1.15 | 1.28 | 1.25 | 1.16 | ||
| Toronto 3 | N | AM | 1.10 | 1.11 | 1.08 | 1.08 | 1.11 | 1.09 | 1.10 | 1.10 | 1.08 |
| PM | 2.18 | 2.10 | 1.44 | 1.82 | 2.02 | 1.46 | 2.02 | 2.06 | 1.48 | ||
| S | AM | 1.38 | 1.40 | 1.09 | 1.28 | 1.34 | 1.10 | 1.75 | 1.93 | 1.17 | |
| PM | 1.38 | 1.28 | 1.15 | 1.29 | 1.32 | 1.24 | 1.29 | 1.27 | 1.20 | ||
| Notes: The TTI is the ratio of peak period travel time to free-flow travel time. For example, a TTI of 2.00 means a trip would take twice as long during the peak period as the same trip in free-flow conditions. A TTI of 1.00 represents free-flowing traffic. "N", "S", “E” and “W” refer to the northbound, southbound, eastbound and westbound directions on the corridor (respectively), and "AM" and "PM" refer to the morning and afternoon peak periods (respectively). The morning peak period is defined from 6:00 AM to 9:59 AM, and the afternoon peak period is defined from 3:00 PM to 6:59 PM. Source: HERE Technologies Traffic Analytics data, methodology developed by Transport Canada based on Texas A&M methodology. |
Montreal
Montreal Super AdminMaps of Montreal show seven corridors: Highway A-40 (three segments), Highway A-10/A-15, Highway A-20/A-25, Highway A-30, and Highway A-20, with travel time index (TTI) data color-coded for each corridor.
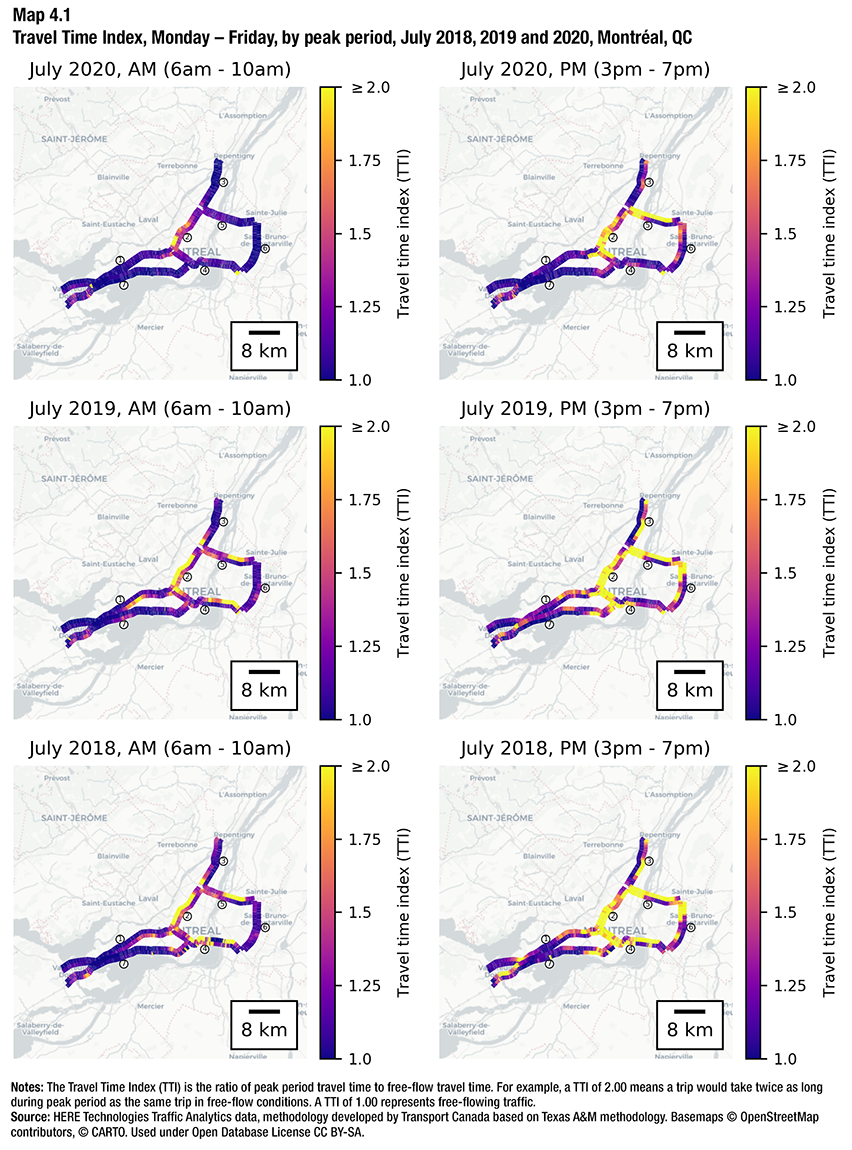
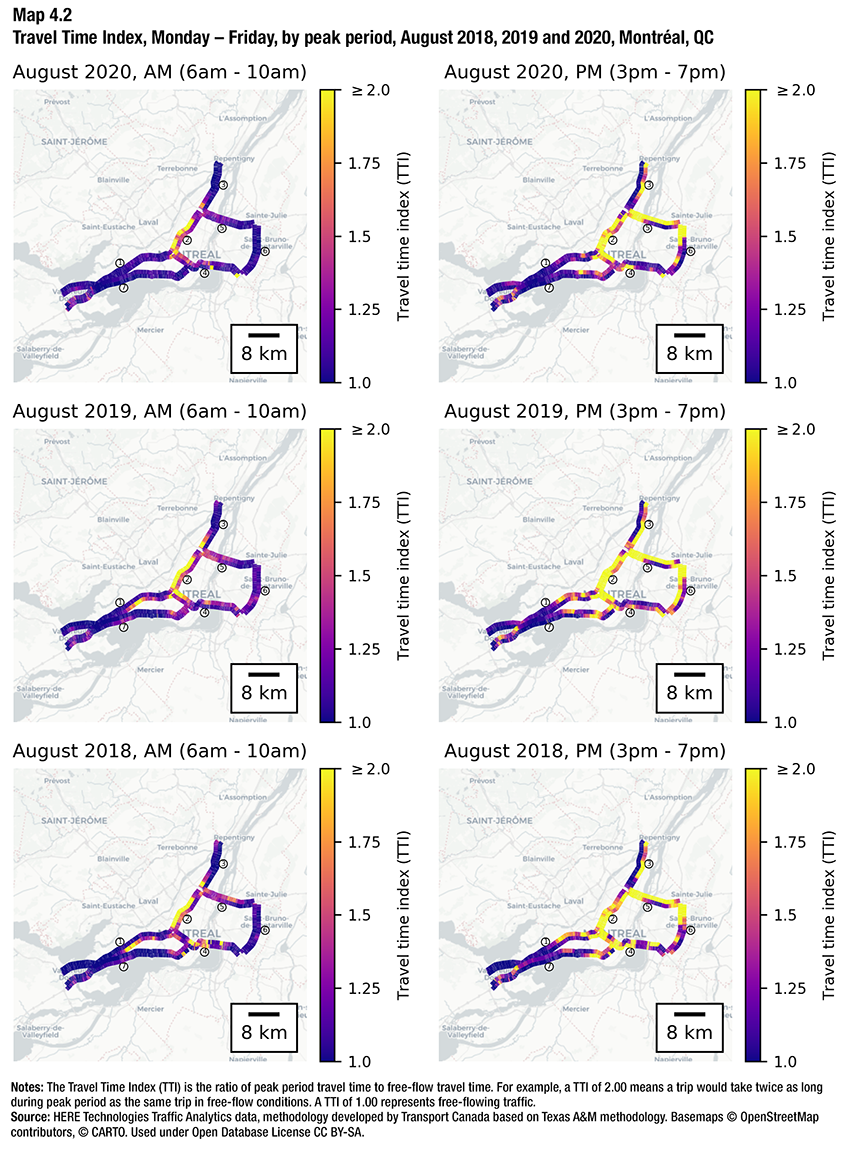
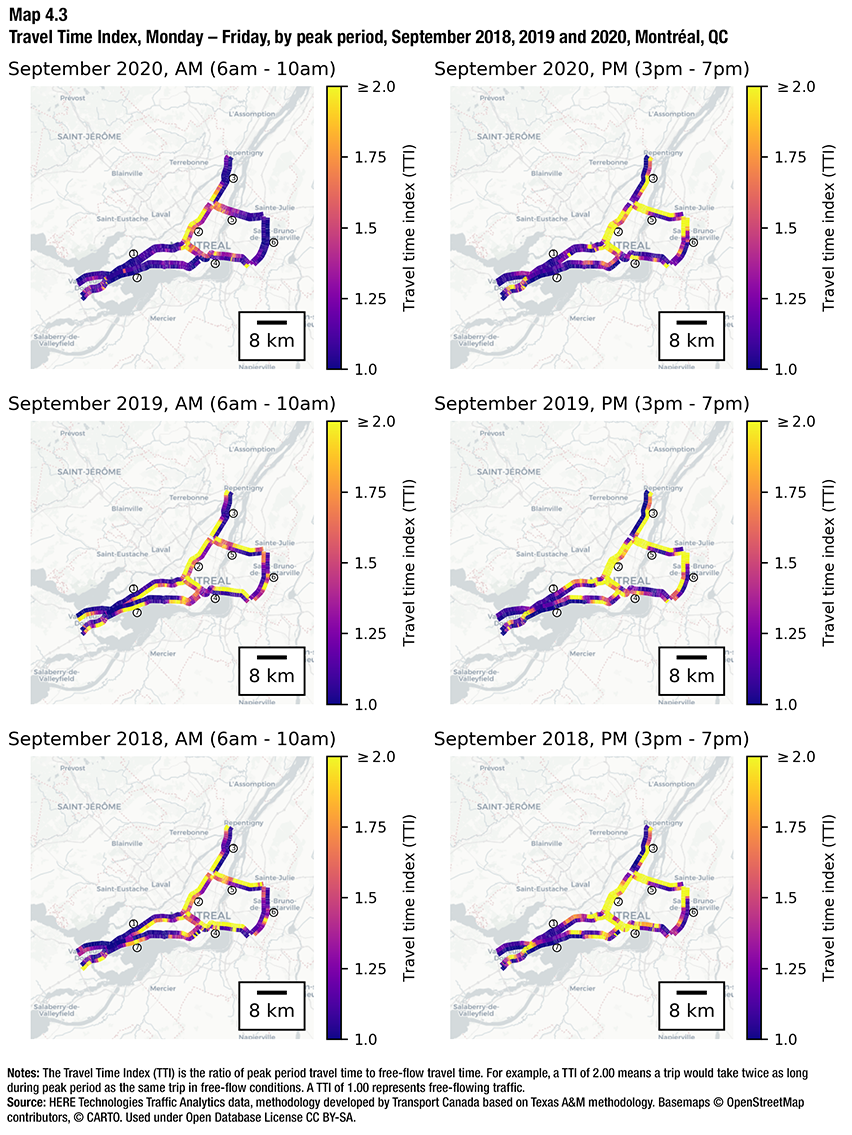
Description for Maps 4.1, 4.2 and 4.3
The maps of Montréal each contain seven corridors:
- Corridor 1 corresponds to highway A-40 between highway A-15 (Boulevard Décarie) in the east and highway A-30 in the west. Its approximate length is 33.5 kilometres.
- Corridor 2 corresponds to highway A-40 between highway A-25 in the east and highway A-15 (Boulevard Décarie) in the west. Its approximate length is 13.5 kilometres.
- Corridor 3 corresponds to highway A-40 between highway A-640 in the east and highway A-25 in the west. Its approximate length is 14 kilometres.
- Corridor 4 corresponds to highway A-10 and highway A-15 between highway A-30 in the east and highway A-40 in the west. Its approximate length is 21 kilometres.
- Corridor 5 corresponds to highway A-20 and highway A-25 between highway A-30 in the east and highway A-40 in the west. Its approximate length is 15 kilometres.
- Corridor 6 corresponds to highway A-30 between highway A-20 in the north and highway A-10 in the south. Its approximate length is 14.5 kilometres.
- Corridor 7 corresponds to highway A-20 between highway A-15 in the east and highway A-30 in the west. Its approximate length is 37.5 kilometres.
Each corridor is colour-coded to represent travel time index along its length. The dark purple colour represents a travel time index of 1.00 and the bright yellow colour represents a travel time index of 2.00 or greater. The aggregated corridor-level travel time index is shown in the table below.
Notes: The Travel Time Index (TTI) is the ratio of peak period travel time to free-flow travel time. For example, a TTI of 2.00 means a trip would take twice as long during peak period as the same trip in free-flow conditions. A TTI of 1.00 represents free-flowing traffic.
Source: HERE Technologies Traffic Analytics data, methodology developed by Transport Canada based on Texas A&M methodology. Basemaps © OpenStreetMap contributors, © CARTO. Used under Open Database License CC BY-SA.
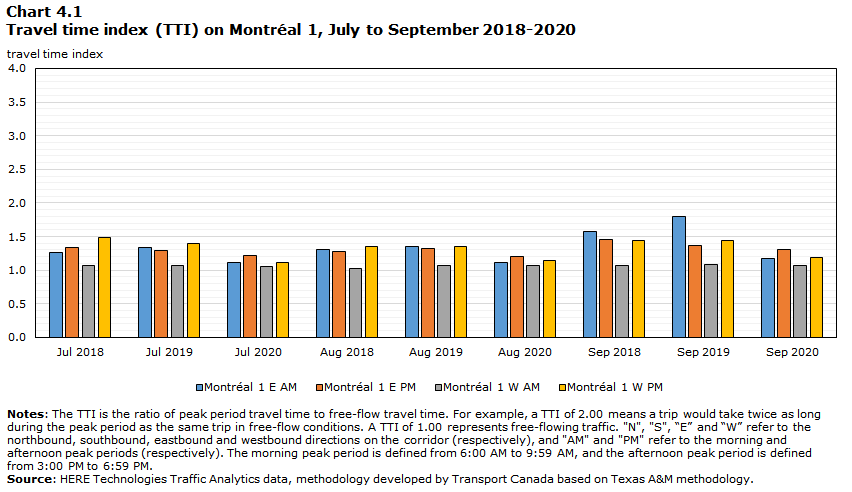
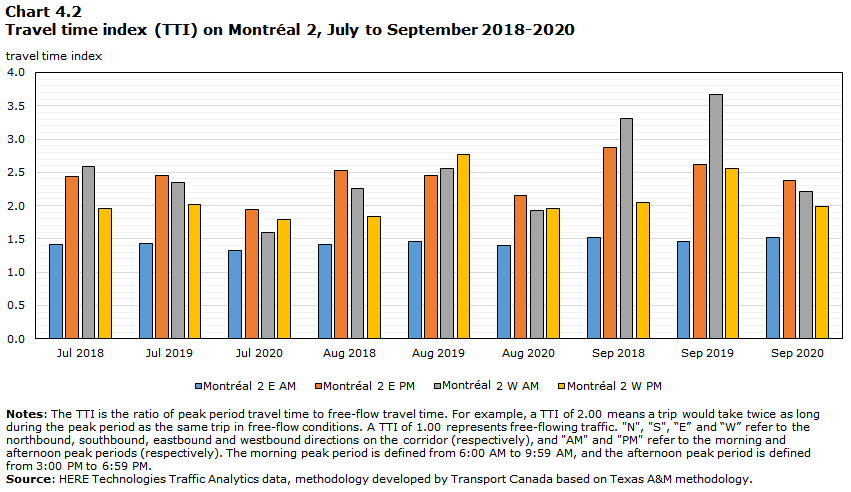
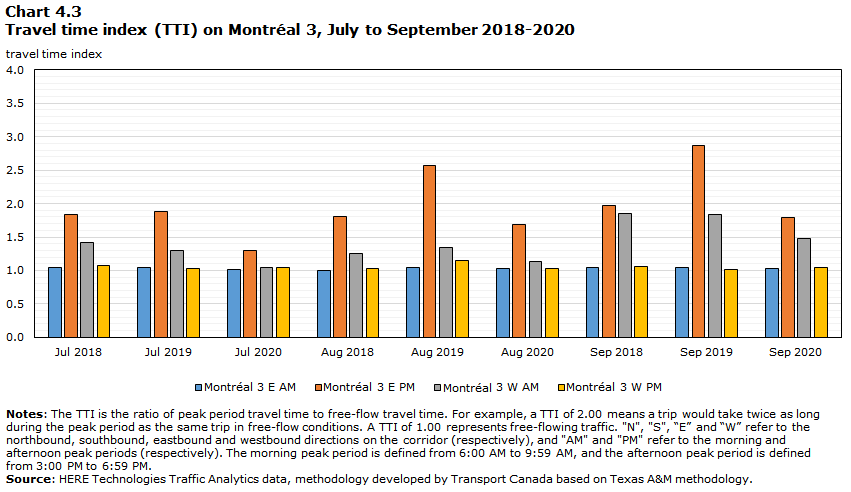
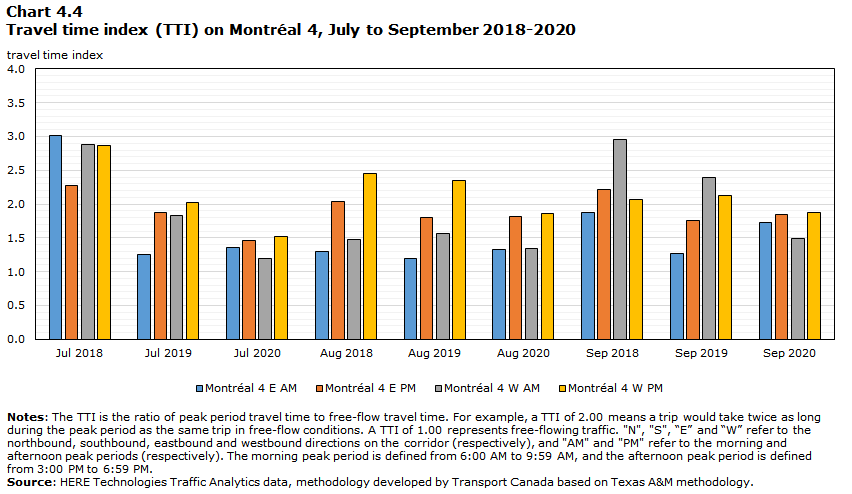
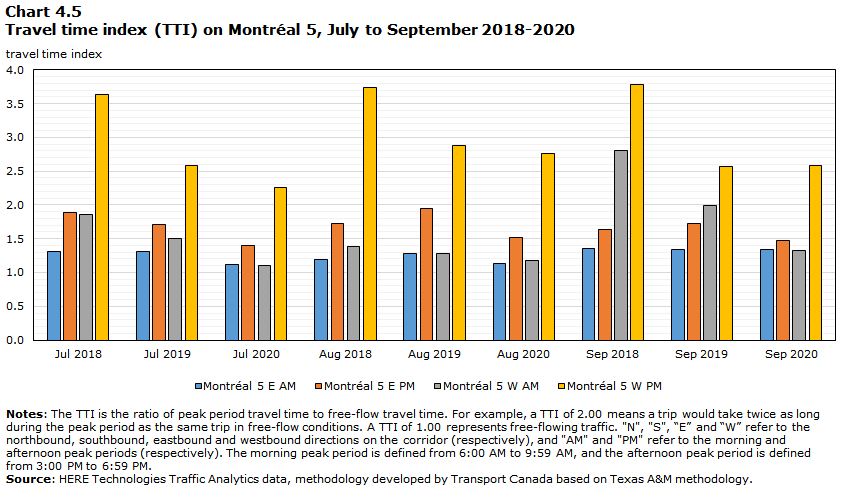
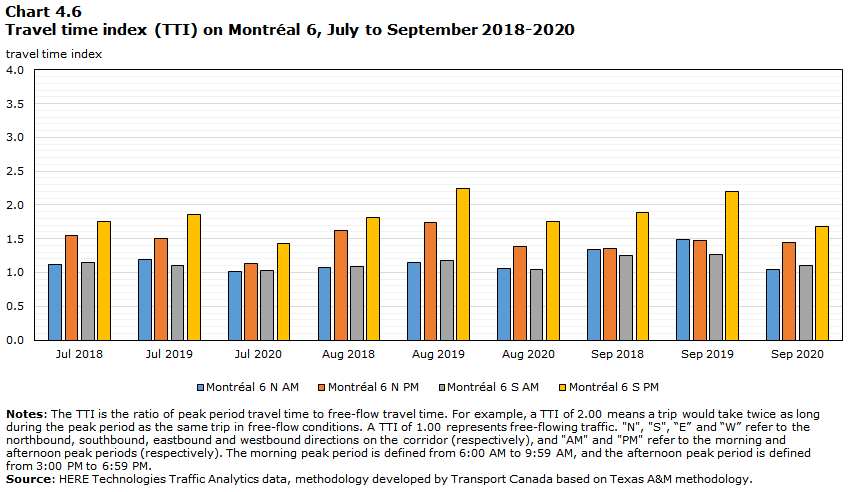
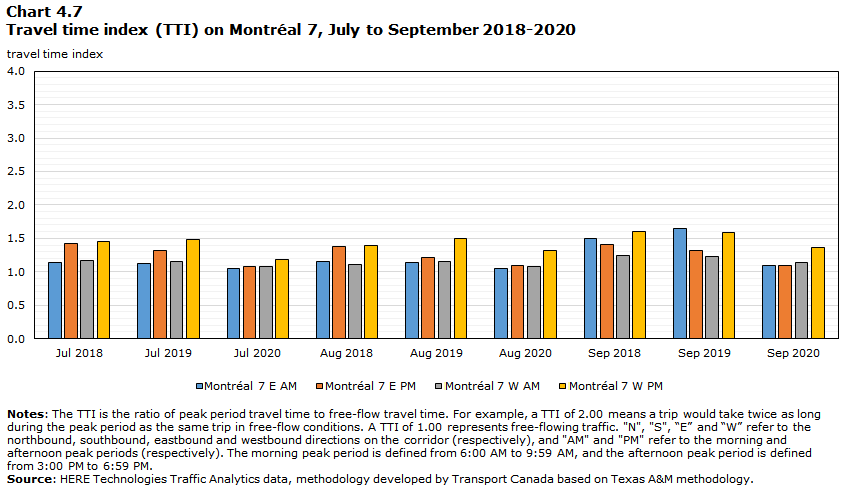
Data table for Charts 4.1, 4.2, 4.3, 4.4, 4.5, 4.6 and 4.7
| Corridor | Direction | Peak period | Jul 2018 | Jul 2019 | Jul 2020 | Aug 2018 | Aug 2019 | Aug 2020 | Sep 2018 | Sep 2019 | Sep 2020 |
|---|---|---|---|---|---|---|---|---|---|---|---|
| Montréal 1 | E | AM | 1.27 | 1.34 | 1.11 | 1.31 | 1.36 | 1.11 | 1.57 | 1.80 | 1.17 |
| PM | 1.34 | 1.29 | 1.22 | 1.28 | 1.32 | 1.20 | 1.46 | 1.36 | 1.31 | ||
| W | AM | 1.06 | 1.07 | 1.06 | 1.02 | 1.07 | 1.07 | 1.06 | 1.08 | 1.07 | |
| PM | 1.49 | 1.39 | 1.11 | 1.36 | 1.35 | 1.15 | 1.43 | 1.45 | 1.19 | ||
| Montréal 2 | E | AM | 1.41 | 1.43 | 1.32 | 1.42 | 1.46 | 1.41 | 1.52 | 1.47 | 1.51 |
| PM | 2.43 | 2.45 | 1.93 | 2.53 | 2.45 | 2.16 | 2.87 | 2.61 | 2.38 | ||
| W | AM | 2.59 | 2.35 | 1.60 | 2.25 | 2.55 | 1.93 | 3.31 | 3.66 | 2.21 | |
| PM | 1.96 | 2.02 | 1.79 | 1.84 | 2.77 | 1.96 | 2.04 | 2.56 | 1.98 | ||
| Montréal 3 | E | AM | 1.05 | 1.05 | 1.02 | 1.00 | 1.04 | 1.02 | 1.05 | 1.04 | 1.03 |
| PM | 1.84 | 1.88 | 1.30 | 1.81 | 2.57 | 1.68 | 1.97 | 2.87 | 1.79 | ||
| W | AM | 1.41 | 1.30 | 1.04 | 1.26 | 1.35 | 1.13 | 1.85 | 1.84 | 1.47 | |
| PM | 1.08 | 1.03 | 1.04 | 1.02 | 1.15 | 1.03 | 1.05 | 1.01 | 1.05 | ||
| Montréal 4 | E | AM | 3.02 | 1.25 | 1.36 | 1.30 | 1.19 | 1.33 | 1.88 | 1.28 | 1.73 |
| PM | 2.27 | 1.88 | 1.47 | 2.04 | 1.80 | 1.82 | 2.21 | 1.75 | 1.85 | ||
| W | AM | 2.88 | 1.83 | 1.20 | 1.48 | 1.57 | 1.35 | 2.95 | 2.40 | 1.50 | |
| PM | 2.86 | 2.02 | 1.52 | 2.45 | 2.35 | 1.86 | 2.07 | 2.13 | 1.87 | ||
| Montréal 5 | E | AM | 1.30 | 1.31 | 1.12 | 1.19 | 1.27 | 1.14 | 1.36 | 1.34 | 1.33 |
| PM | 1.88 | 1.71 | 1.40 | 1.73 | 1.94 | 1.51 | 1.64 | 1.73 | 1.48 | ||
| W | AM | 1.86 | 1.50 | 1.11 | 1.39 | 1.28 | 1.18 | 2.81 | 1.99 | 1.32 | |
| PM | 3.64 | 2.58 | 2.26 | 3.74 | 2.87 | 2.76 | 3.78 | 2.57 | 2.58 | ||
| Montréal 6 | N | AM | 1.12 | 1.19 | 1.01 | 1.07 | 1.15 | 1.05 | 1.34 | 1.48 | 1.05 |
| PM | 1.55 | 1.50 | 1.13 | 1.62 | 1.74 | 1.38 | 1.36 | 1.48 | 1.44 | ||
| S | AM | 1.15 | 1.10 | 1.03 | 1.08 | 1.18 | 1.05 | 1.24 | 1.27 | 1.10 | |
| PM | 1.75 | 1.86 | 1.43 | 1.81 | 2.24 | 1.76 | 1.89 | 2.21 | 1.69 | ||
| Montréal 7 | E | AM | 1.14 | 1.13 | 1.05 | 1.15 | 1.14 | 1.05 | 1.50 | 1.64 | 1.10 |
| PM | 1.42 | 1.31 | 1.08 | 1.38 | 1.22 | 1.09 | 1.41 | 1.32 | 1.10 | ||
| W | AM | 1.17 | 1.15 | 1.08 | 1.11 | 1.15 | 1.08 | 1.24 | 1.23 | 1.14 | |
| PM | 1.45 | 1.49 | 1.18 | 1.40 | 1.49 | 1.32 | 1.60 | 1.58 | 1.36 | ||
| Notes: The TTI is the ratio of peak period travel time to free-flow travel time. For example, a TTI of 2.00 means a trip would take twice as long during the peak period as the same trip in free-flow conditions. A TTI of 1.00 represents free-flowing traffic. "N", "S", “E” and “W” refer to the northbound, southbound, eastbound and westbound directions on the corridor (respectively), and "AM" and "PM" refer to the morning and afternoon peak periods (respectively). The morning peak period is defined from 6:00 AM to 9:59 AM, and the afternoon peak period is defined from 3:00 PM to 6:59 PM. Source: HERE Technologies Traffic Analytics data, methodology developed by Transport Canada based on Texas A&M methodology. |
Halifax
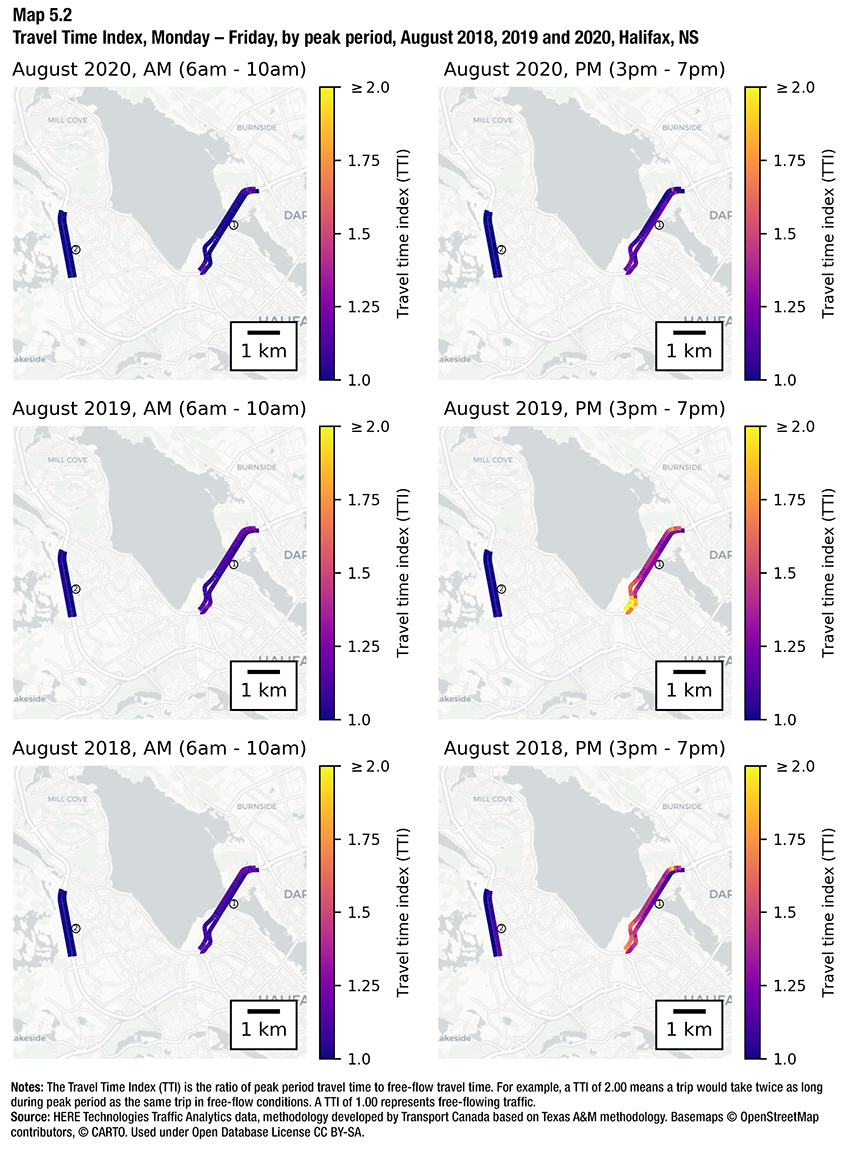
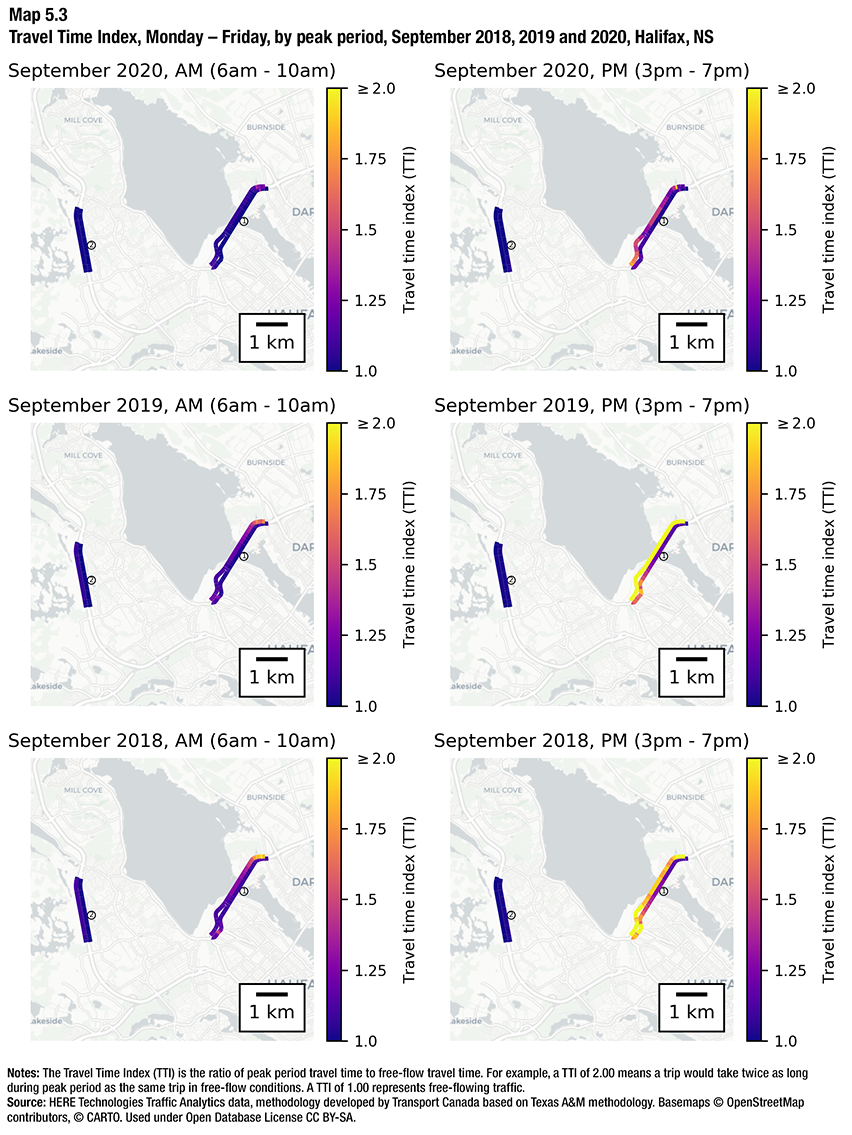
Halifax Super AdminMaps of Halifax show two corridors: Highway 111 and Highway 102, with travel time index (TTI) data color-coded for each corridor.
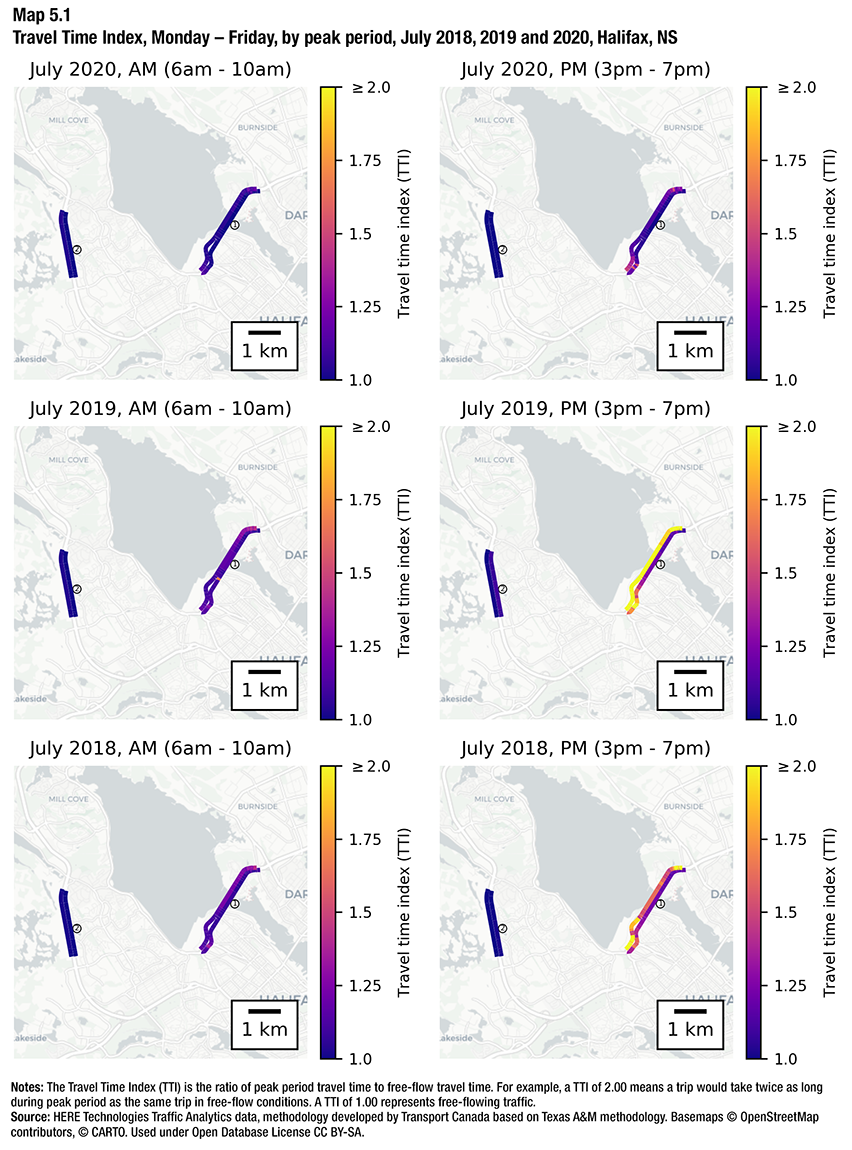
Description for Maps 5.1, 5.2 and 5.3
The maps of Halifax each contain two corridors:
- Corridor 1 corresponds to highway 111 between highway 7 in the east and highway 2 in the west. Its approximate length is 3.5 kilometres.
- Corridor 2 corresponds to highway 102 between Kearney Lake Rd in the north and Lacewood Dr in the south. Its approximate length is 3 kilometres.
Each corridor is colour-coded to represent travel time index along its length. The dark purple colour represents a travel time index of 1.00 and the bright yellow colour represents a travel time index of 2.00 or greater. The aggregated corridor-level travel time index is shown in the table below.
Notes: The Travel Time Index (TTI) is the ratio of peak period travel time to free-flow travel time. For example, a TTI of 2.00 means a trip would take twice as long during peak period as the same trip in free-flow conditions. A TTI of 1.00 represents free-flowing traffic.
Source: HERE Technologies Traffic Analytics data, methodology developed by Transport Canada based on Texas A&M methodology. Basemaps © OpenStreetMap contributors, © CARTO. Used under Open Database License CC BY-SA.
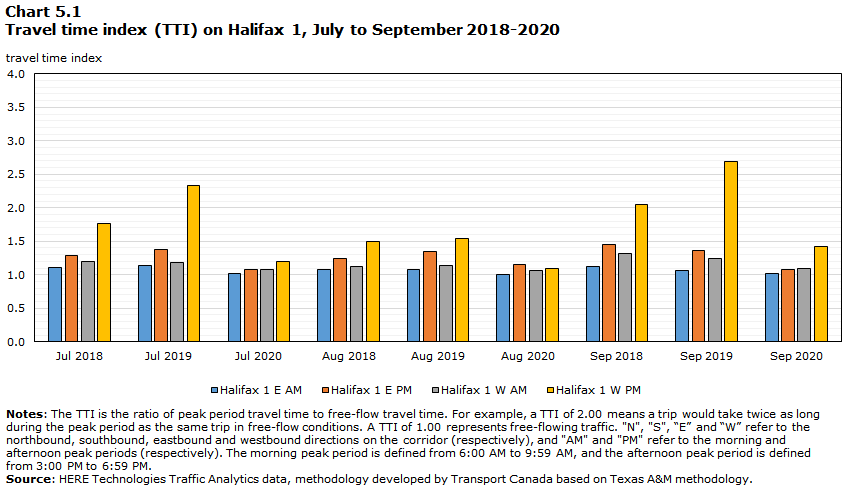
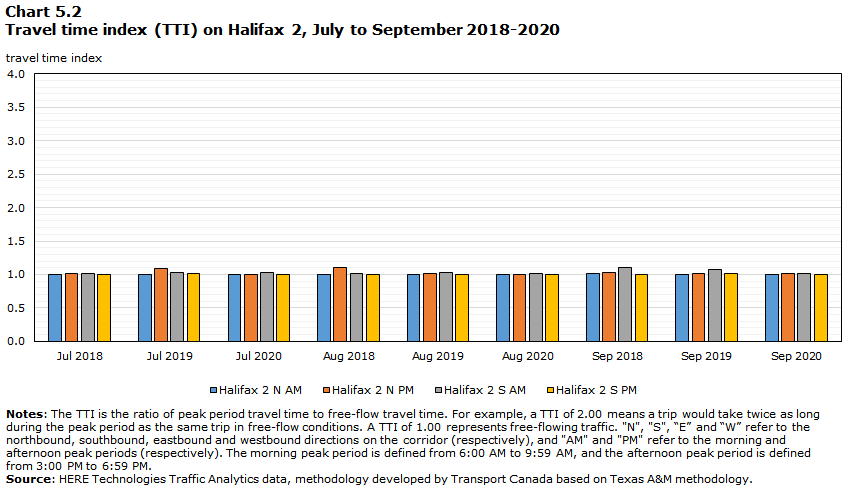
Data table for Charts 5.1 and 5.2
| Corridor | Direction | Peak period | Jul 2018 | Jul 2019 | Jul 2020 | Aug 2018 | Aug 2019 | Aug 2020 | Sep 2018 | Sep 2019 | Sep 2020 |
|---|---|---|---|---|---|---|---|---|---|---|---|
| Halifax 1 | E | AM | 1.10 | 1.13 | 1.02 | 1.08 | 1.08 | 1.00 | 1.13 | 1.06 | 1.01 |
| PM | 1.29 | 1.37 | 1.08 | 1.24 | 1.35 | 1.15 | 1.46 | 1.35 | 1.09 | ||
| W | AM | 1.20 | 1.19 | 1.08 | 1.13 | 1.14 | 1.06 | 1.31 | 1.25 | 1.09 | |
| PM | 1.76 | 2.33 | 1.20 | 1.50 | 1.55 | 1.09 | 2.05 | 2.70 | 1.42 | ||
| Halifax 2 | N | AM | 1.01 | 1.01 | 0.99 | 0.99 | 1.00 | 0.99 | 1.01 | 1.00 | 1.00 |
| PM | 1.01 | 1.09 | 1.00 | 1.10 | 1.01 | 1.00 | 1.03 | 1.02 | 1.01 | ||
| S | AM | 1.02 | 1.03 | 1.03 | 1.01 | 1.03 | 1.01 | 1.10 | 1.07 | 1.01 | |
| PM | 1.00 | 1.01 | 1.00 | 1.00 | 1.01 | 1.00 | 1.00 | 1.02 | 0.99 | ||
| Notes: The TTI is the ratio of peak period travel time to free-flow travel time. For example, a TTI of 2.00 means a trip would take twice as long during the peak period as the same trip in free-flow conditions. A TTI of 1.00 represents free-flowing traffic. "N", "S", “E” and “W” refer to the northbound, southbound, eastbound and westbound directions on the corridor (respectively), and "AM" and "PM" refer to the morning and afternoon peak periods (respectively). The morning peak period is defined from 6:00 AM to 9:59 AM, and the afternoon peak period is defined from 3:00 PM to 6:59 PM. Source: HERE Technologies Traffic Analytics data, methodology developed by Transport Canada based on Texas A&M methodology. |
More information
More information Super AdminNote of appreciation
Canada owes the success of its statistical system to a long-standing partnership between Statistics Canada, the citizens of Canada, its businesses, governments and other institutions. Accurate and timely statistical information could not be produced without their continued co-operation and goodwill.
Standards of service to the public
Statistics Canada is committed to serving its clients in a prompt, reliable and courteous manner. To this end, the Agency has developed standards of service which its employees observe in serving its clients.
Copyright
Published by authority of the Minister responsible for Statistics Canada.
© Her Majesty the Queen in Right of Canada as represented by the Minister of Industry, 2021
All rights reserved. Use of this publication is governed by the Statistics Canada Open Licence Agreement.
Catalogue no. 23-26-0001
Frequency: Occasional
Ottawa